
| Quick answer: SEO Inspector is a free Chrome extension that audits the page you are viewing in one click. It checks the title, meta description, headings, links, images, canonical, robots directives, structured data, Open Graph tags, and content, gives you a checklist score out of 100, and explains every check in plain English. No account or subscription is required, and the analysis runs in your browser. Install it from the Chrome Web Store, open any page, click the icon (or press Alt+Shift+S), and fix what it flags, starting with the critical issues. |
Every screenshot in this guide comes from SEO Inspector 1.0.0. To show you real problems instead of a perfect page, we ran it on a demo service page for a fictional dental clinic, Sunrise Dental, with a few common SEO mistakes planted on purpose. You will see the extension catch each one, and at the end you will see the score after we fixed them.
By the end, you will know how to:
- install SEO Inspector and open it on any page
- read the checklist score and decide what to fix first
- check titles, meta descriptions, headings, links and images in seconds
- confirm a page can be indexed and that its schema is not broken
- use the built-in robots.txt tester, sitemap inspector, header check and page timing
- export a clean audit report for a client or your team
New to SEO? Start with what on-page SEO is and my on-page SEO checklist, then come back to this guide.
What is SEO Inspector?
SEO Inspector is a free on-page SEO checker that lives in your Chrome toolbar. It is designed for quick page-level reviews and complements a full technical SEO audit rather than replacing a site-wide crawler. I built it for SEO specialists, marketers, developers and site owners who want fast, clear answers about a page without signing up for anything. Open it on a page and it shows what search engines and social platforms can read from that page, which issues need attention and, most importantly, why.
Many SEO tools give you a score and a list of red flags. SEO Inspector shows the points behind every check, so you can see exactly where the score comes from and decide for yourself what matters for that page.
| Feature | Details |
|---|---|
| Price | Free. No account, subscription or ads |
| Works in | Google Chrome 116 or newer, as a popup or in the side panel |
| Checks | Title, meta description, headings, links, images, indexability, structured data, Open Graph and X cards, search preview and content |
| Built-in tools | robots.txt tester, sitemap inspector, HTTP header check, raw vs rendered HTML, page timing and optional PageSpeed Insights |
| Export | HTML report, CSV or JSON |
| Privacy | Analysis runs locally in your browser. Page content is not sent to any server |
| Keyboard shortcut | Alt+Shift+S |
| Version | 1.0.0, updated October 11, 2026 (277 KiB) |
SEO Inspector at a glance. Source: Chrome Web Store listing, checked November 2026.
| Important The SEO Inspector score is a technical checklist score, not a Google ranking score. It does not predict rankings or traffic, and it only counts checks the extension can actually verify on the page. |
Step 1: Install SEO Inspector from the Chrome Web Store
- Open the SEO Inspector page on the Chrome Web Store.
- Check that you have the right listing: the blue magnifying-glass icon, with anandbajrangi.com as the developer website (Figure 2).
- Click Add to Chrome, then click Add extension in the confirmation box.
- Click the puzzle-piece Extensions icon in Chrome’s toolbar and click the pin next to SEO Inspector, so its icon stays visible.
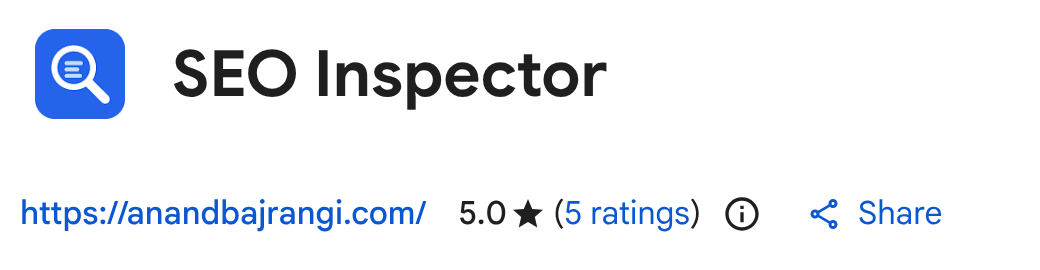
Figure 2: The SEO Inspector listing on the Chrome Web Store, published by anandbajrangi.com.
| Good to know SEO Inspector asks for minimal permissions. By default it can read a page only after you click its icon on that tab. Access to all sites is optional, and you only need it if you want the side panel to follow you from page to page (see Step 11). |
Step 2: Open SEO Inspector on any page
Go to the page you want to check. It can be your own page or a competitor’s. Then do one of these:
- click the SEO Inspector icon in the toolbar, or
- press Alt+Shift+S (Option+Shift+S on a Mac). You can change the shortcut at chrome://extensions/shortcuts.
The checks run in a moment and the popup opens on the Overview tab. Here is what each part of the window does (Figure 3):
- Highlight on page (marker 1) opens a menu to outline headings, links, images, image issues and head tags such as noindex, canonical and schema directly on the page.
- Export report (marker 2) downloads the audit as an HTML report, CSV or JSON.
- Open in side panel (marker 3) moves SEO Inspector into Chrome’s side panel so it stays open while you work.
- Re-analyze page (marker 4) runs the checks again after you change something.
- Settings (marker 5) opens scoring weights, length guidelines and site access.
- The tab bar (marker 6) holds 11 tabs: Overview, Meta, Headings, Links, Images, Indexing, Schema, Social, SERP, Content and Tools. A number on a tab shows how many issues it found there.
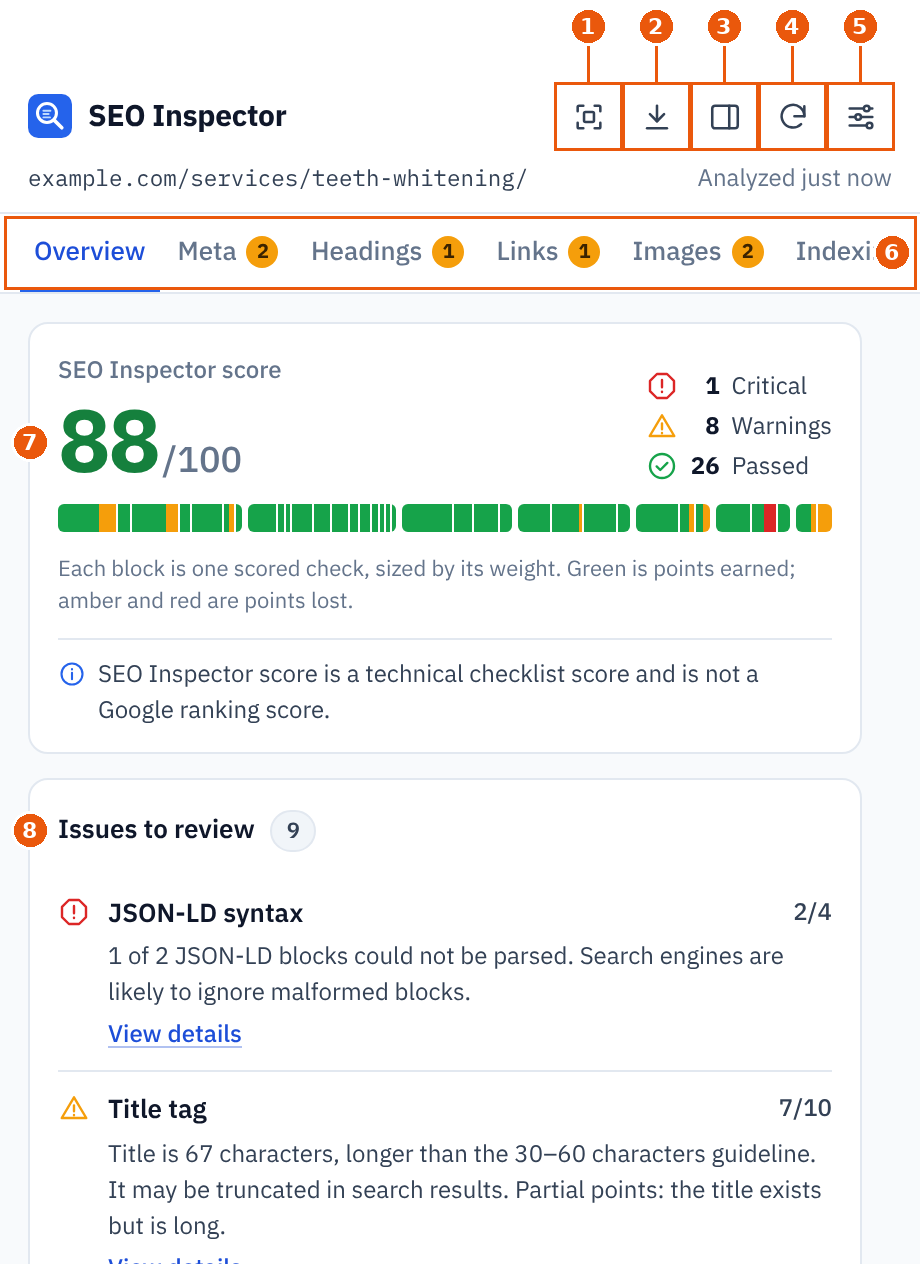
Figure 3: SEO Inspector on our demo page: toolbar buttons (markers 1 to 5), the tab bar (marker 6), the score (marker 7) and the issues list (marker 8).
Step 3: Read the score and the “Issues to review” list
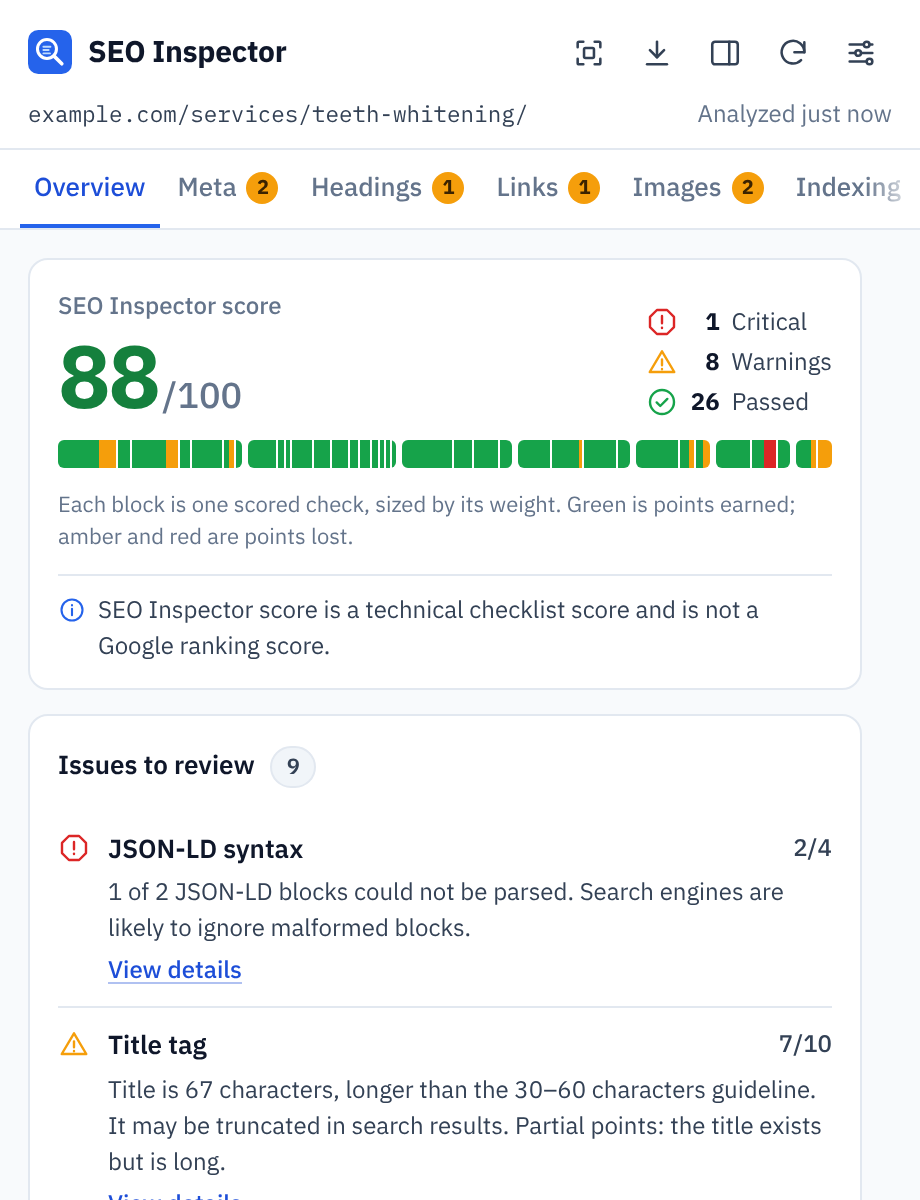
The Overview tab is your summary. Our demo page scored 88/100 (marker 7), with 1 critical issue, 8 warnings and 26 passed checks.
The coloured bar under the score is worth a closer look. Each block is one scored check, sized by its weight. Green blocks are points earned, and amber and red blocks are points lost. One glance tells you whether you are losing points in one place or in many.
Below that, Issues to review (marker 8) lists every problem, critical issues first, with the points each check scored (for example, 2/4) and a one-line explanation. Click View details under any issue to see the exact value the extension found (Figure 4).
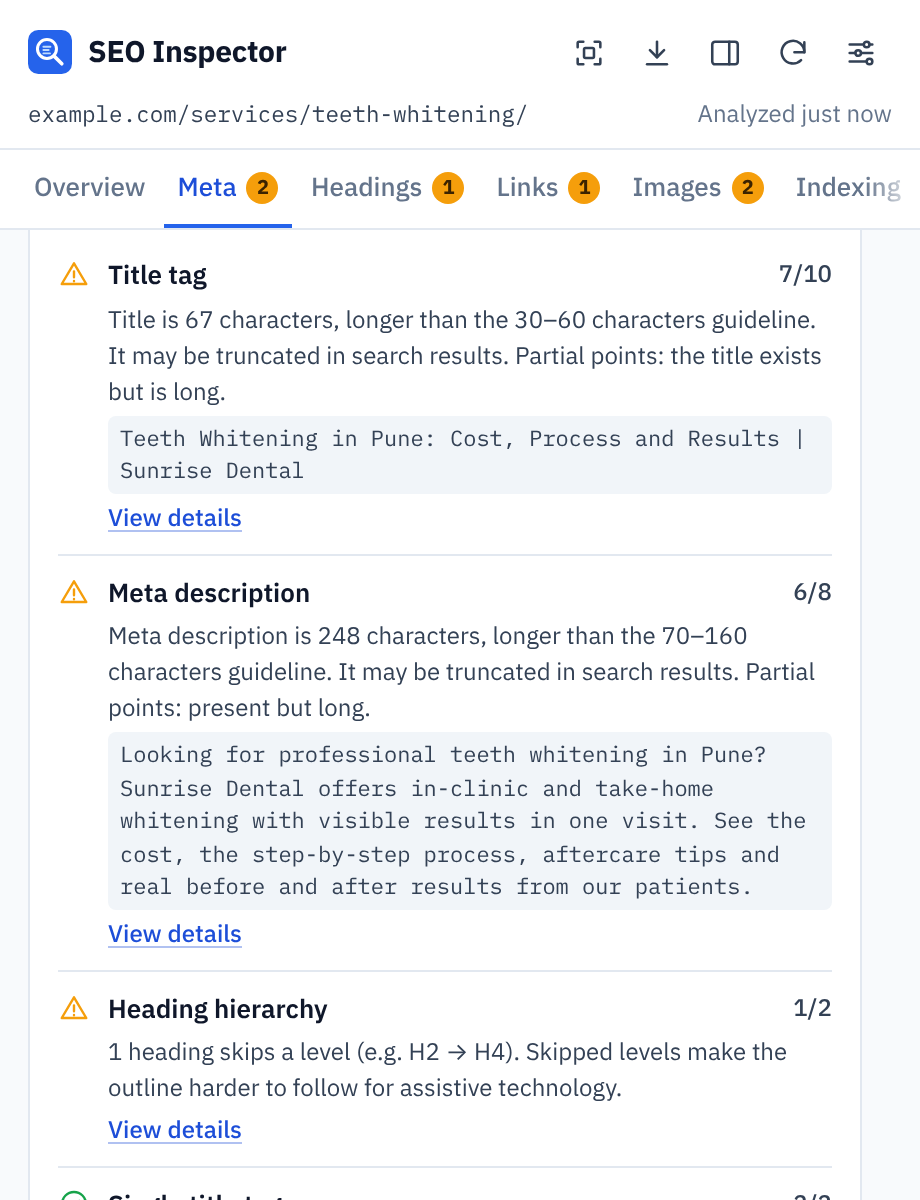
Figure 4: View details shows the evidence behind each check, here the full title and meta description.
How the score is calculated
Scroll down the Overview tab to Categories (Figure 5). The score is split into seven weighted categories:
| Category | What it checks | Default weight |
|---|---|---|
| On-Page SEO | Title, meta description and heading structure | 25 |
| Technical SEO | Indexability, canonical, HTTPS, viewport, language and status | 20 |
| Content | Visible text volume, paragraphs and sentence length | 15 |
| Links | Internal links, anchor text and crawlable hrefs | 15 |
| Images | Alt attributes, alt text quality and explicit dimensions | 10 |
| Schema | Presence and JSON syntax of structured data | 10 |
| Social | Open Graph and Twitter/X card metadata | 5 |
Click any category to see the checks inside it. If some categories matter more to you than others, change the weights in Settings (Step 11). Page at a glance under the categories repeats the essentials: title, description, H1, indexability, canonical, content counts and schema types.
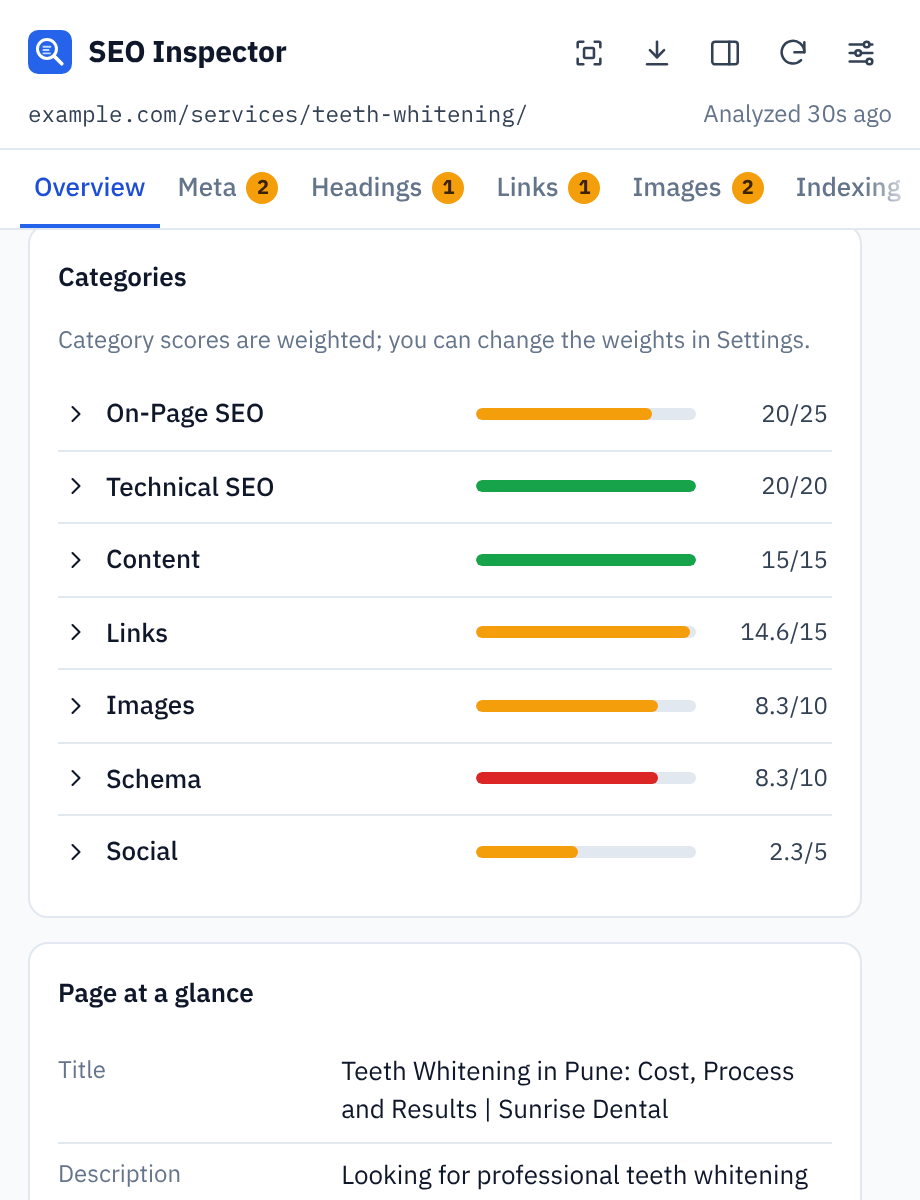
Figure 5: Category scores and the Page at a glance summary on the Overview tab.
| Tip Fix critical (red) issues first, then warnings. Don’t chase 100/100 for its own sake. A warning such as a slightly long title can be the right call for a particular page. |
Step 4: Check your title tag and meta description (Meta tab)
The Meta tab shows your title and meta description with their length in characters and an approximate width in pixels (Figure 6). Search engines cut off titles and descriptions by pixel width, not by characters, so the pixel bar is the more useful number.
On our demo page, both were flagged as May be truncated:
- the title was 67 characters (about 611 px of ~600 px), over the 30 to 60 character guideline
- the meta description was 248 characters (about 1,488 px of ~1,200 px), over the 70 to 160 character guideline
Further down, Page summary counts your H1 to H6 headings, words, paragraphs, images and links, and Head elements lists the canonical, robots meta, language, charset, viewport, doctype and favicon. It is the quickest way to spot a missing viewport tag or a stray meta refresh.
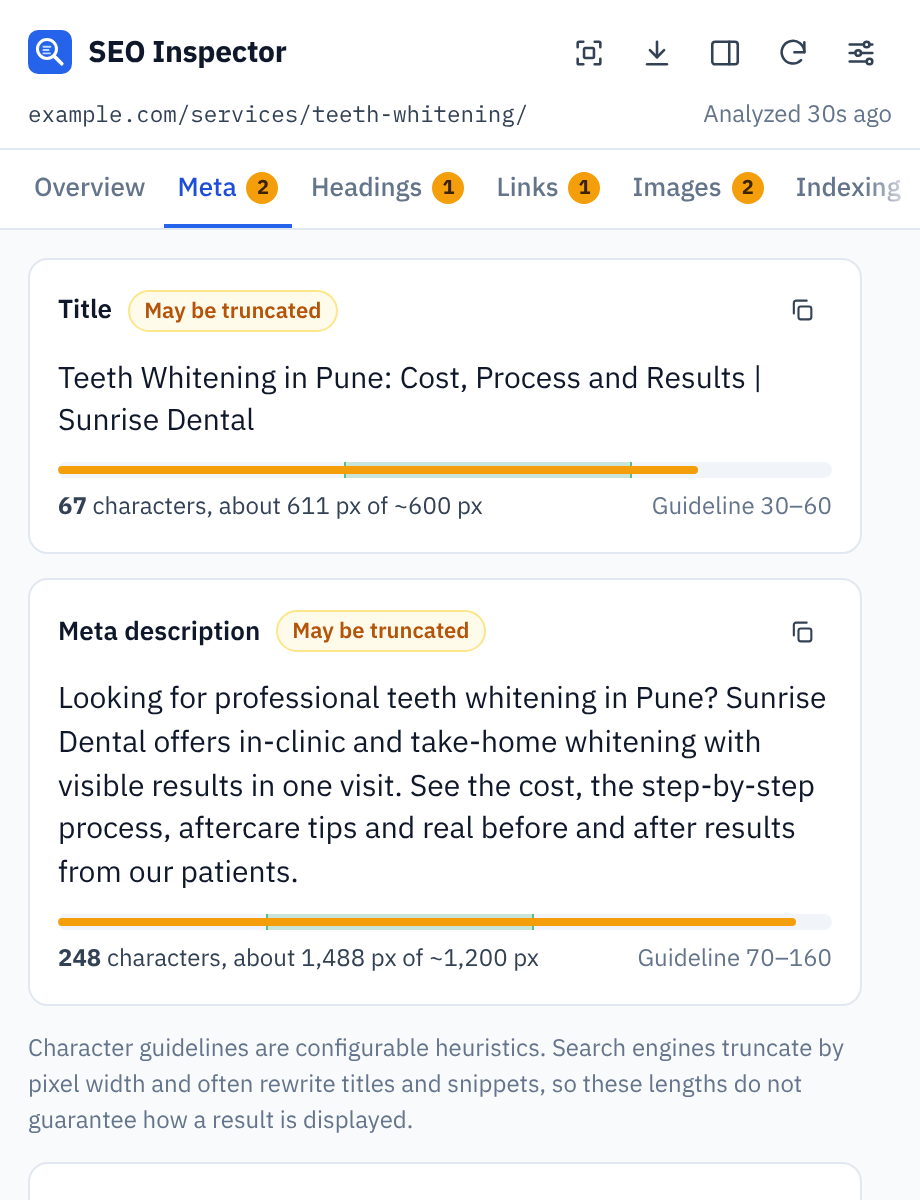
Figure 6: The Meta tab flags a title and a meta description that may be truncated in search results.
For help writing better ones, read my guides to SEO title tags and meta descriptions.
Step 5: Preview and rewrite your search snippet (SERP tab)
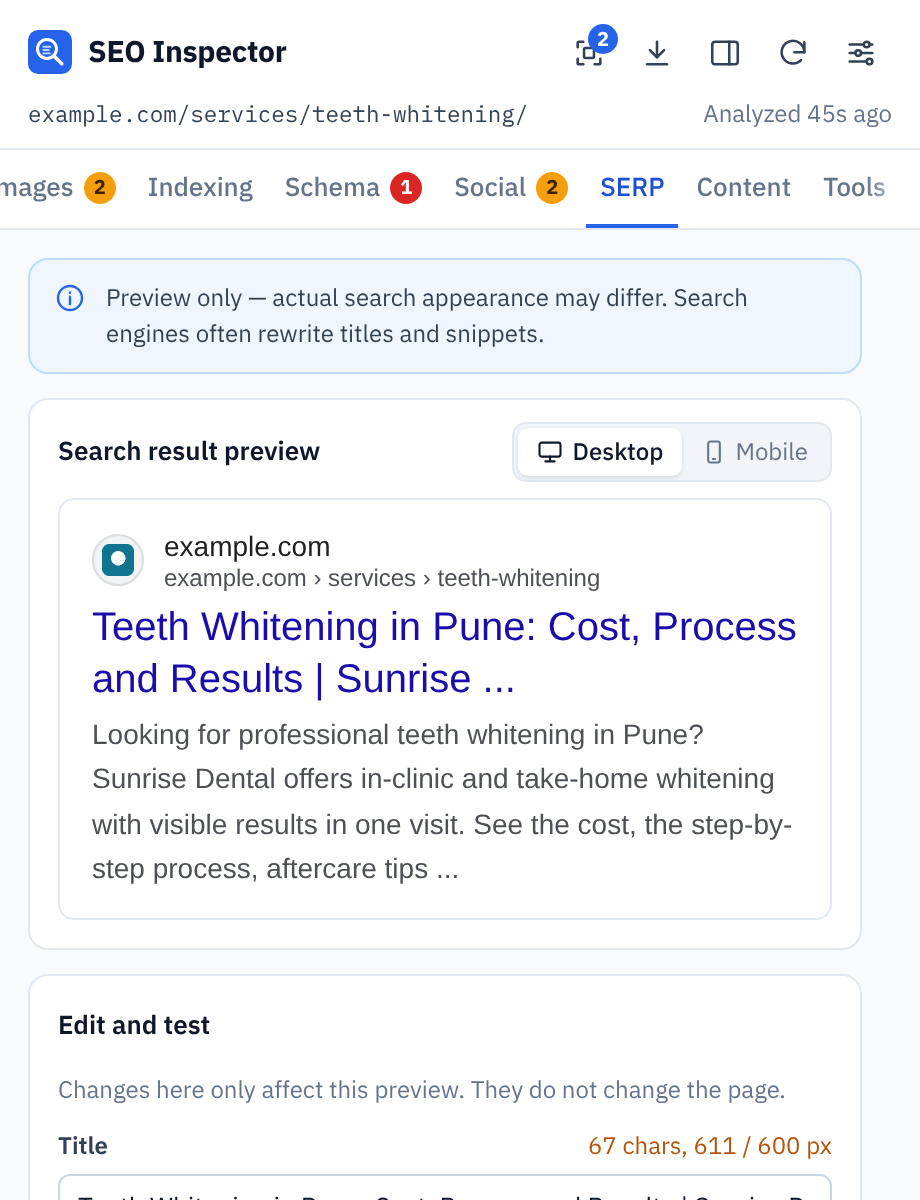
The SERP tab shows roughly how the page could look in a search result, on desktop or mobile. The most useful part is Edit and test: type a new title or description, and the preview, character count and pixel width update as you type. Nothing on the page changes, so you can try as many versions as you like.
We rewrote the demo title to 58 characters (528/600 px) and the description to 149 characters. The cut-off “Sunrise …” in the old preview became a complete title (Figure 7).
 |
 |
Figure 7: The search preview before (left) and after editing the title and description in the SERP tab (right). Changes here only affect the preview.
When you are happy with the wording, copy it into your CMS. In WordPress, that means the SEO title and meta description fields of your SEO plugin, such as Yoast SEO or my free Anand Bajrangi SEO plugin.
| Remember This is a preview, not a promise. Search engines often rewrite titles and snippets. |
Step 6: Check your heading structure (Headings tab)
The Headings tab counts every heading from H1 to H6 and draws the page’s outline as a tree (Figure 8). It flags a missing H1, more than one H1, empty headings and skipped levels.
On our demo page it found 1 level skip. “What is included in the price” was an H4 sitting directly under an H2, and the outline marks it with “skips from H2”. Skipped levels make the outline harder to follow, especially for people who use screen readers.
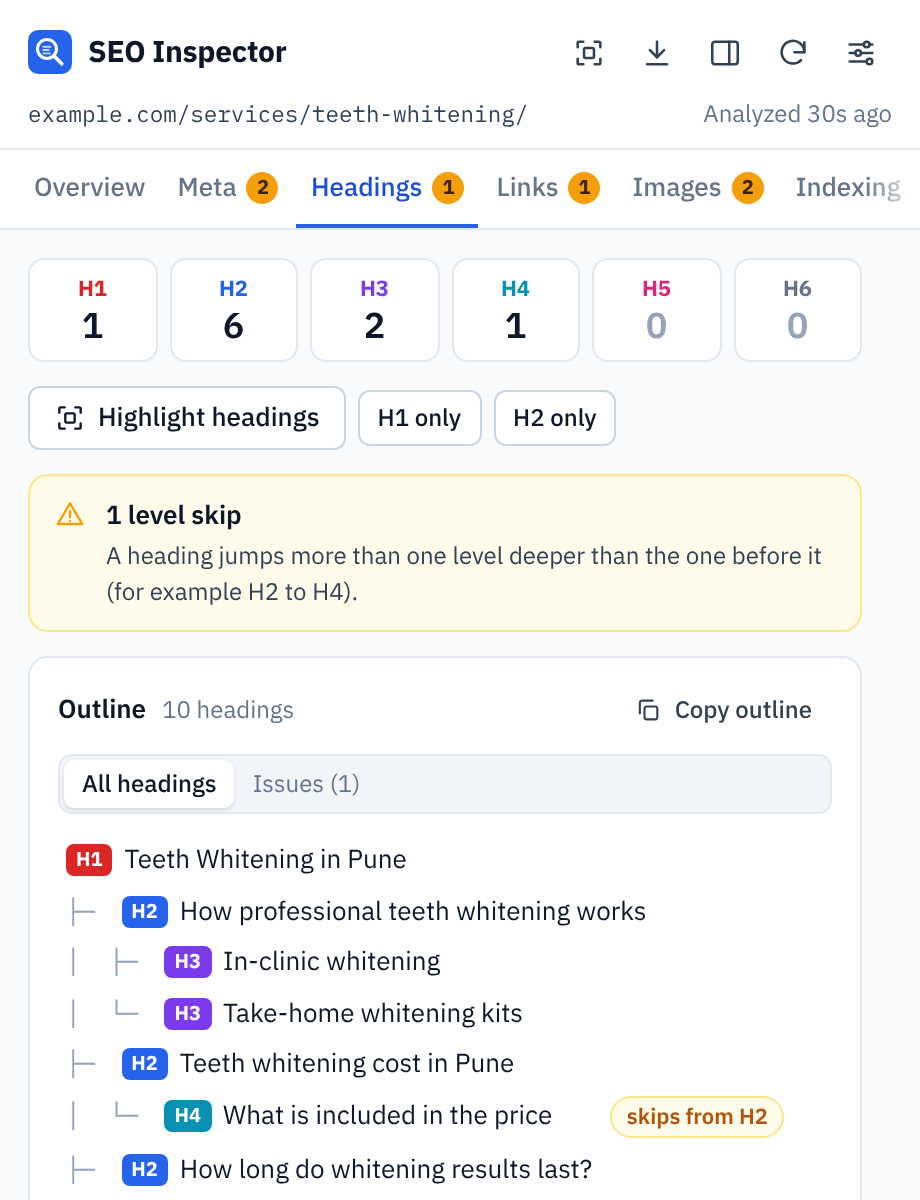
Figure 8: The Headings tab shows the page outline and flags the H4 that skips a level.
Click Copy outline to paste the structure into a content brief, or use H1 only and H2 only to filter the list.
See headings on the page with Highlight mode
You can turn on highlights from the Highlight on page menu (marker 1 in Figure 3) or from the buttons inside each tab. The menu covers all headings, H1s or H2s; internal, external, nofollow/sponsored/UGC links and links without text; all images or only image issues; and head tags such as noindex/robots, canonical and schema (Figure 9).
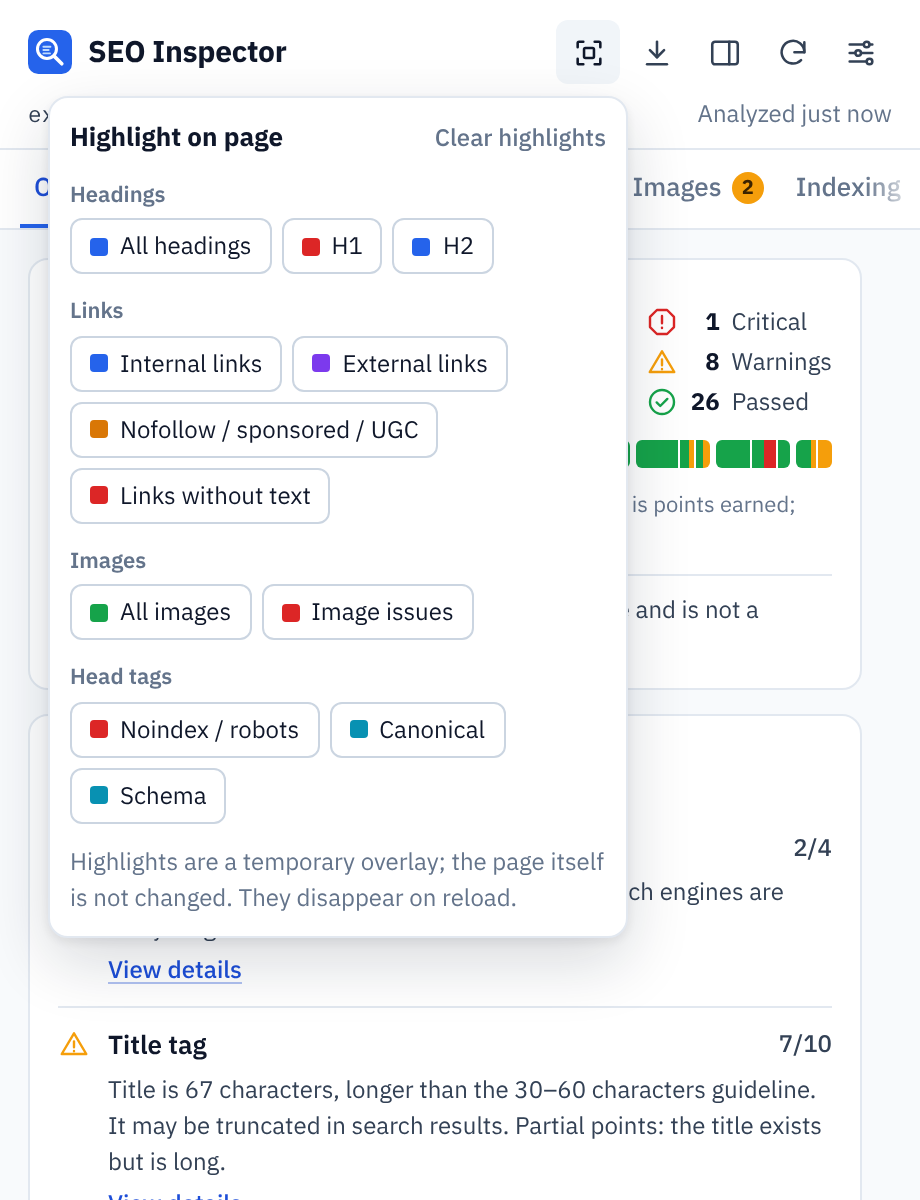
Figure 9: The Highlight on page menu. Highlights disappear when you reload the page.
On the Headings tab, click Highlight headings and SEO Inspector outlines each heading on the page itself, with a coloured H1 to H6 label (Figure 10). An H4 that should be an H3 is much easier to spot in context. The highlights are a temporary overlay: the page itself is never changed, and Clear in the corner removes them.
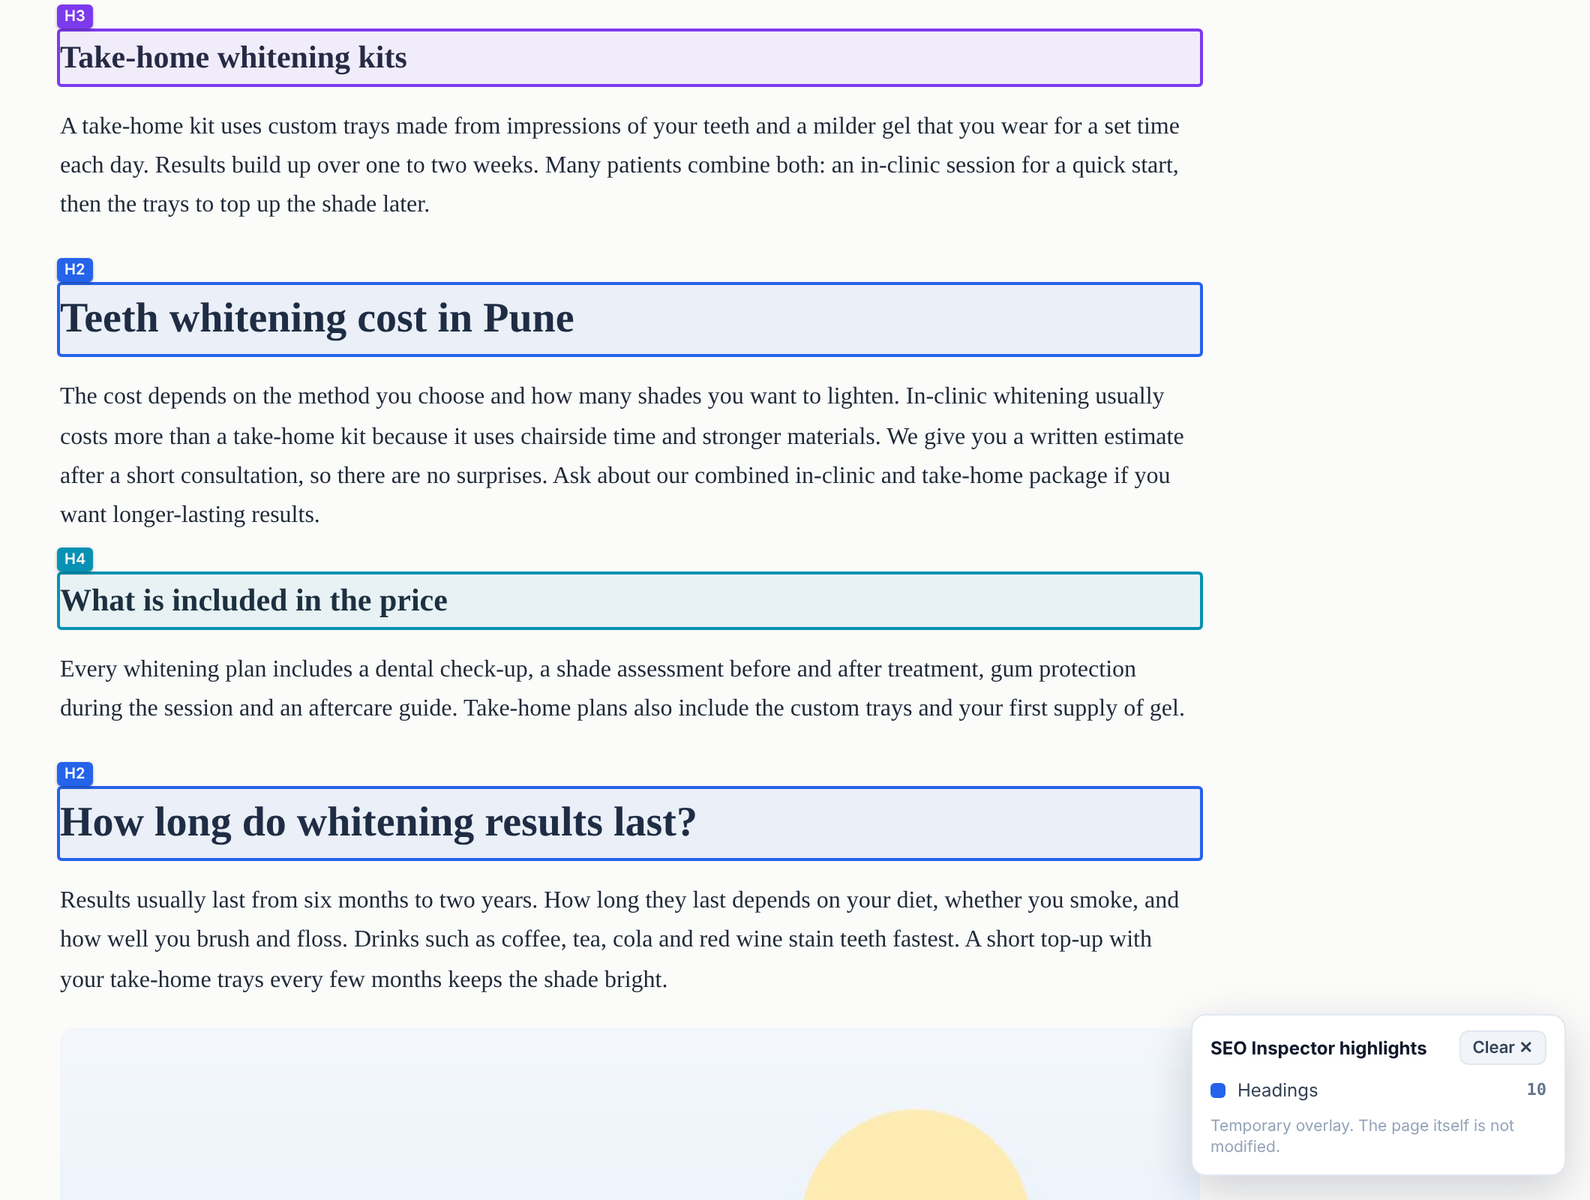
Figure 10: Highlight mode labels every heading on the page. The H4 stands out between two H2 sections.
Step 7: Audit your links and images
Links tab
The Links tab counts total, internal, external, nofollow, sponsored and UGC links, plus links with empty anchor text and links without an href (Figure 11). Use the filter chips or the search box to find a link, Show on page to jump to it, and CSV to export the full list.
Our demo page had 11 links: 8 internal and 3 external, one of them nofollow and one sponsored. It also had 1 empty anchor, an Instagram icon in the footer with no text. Anchor text tells users and search engines what the target page is about, so icon-only links need a text label or an accessible name.
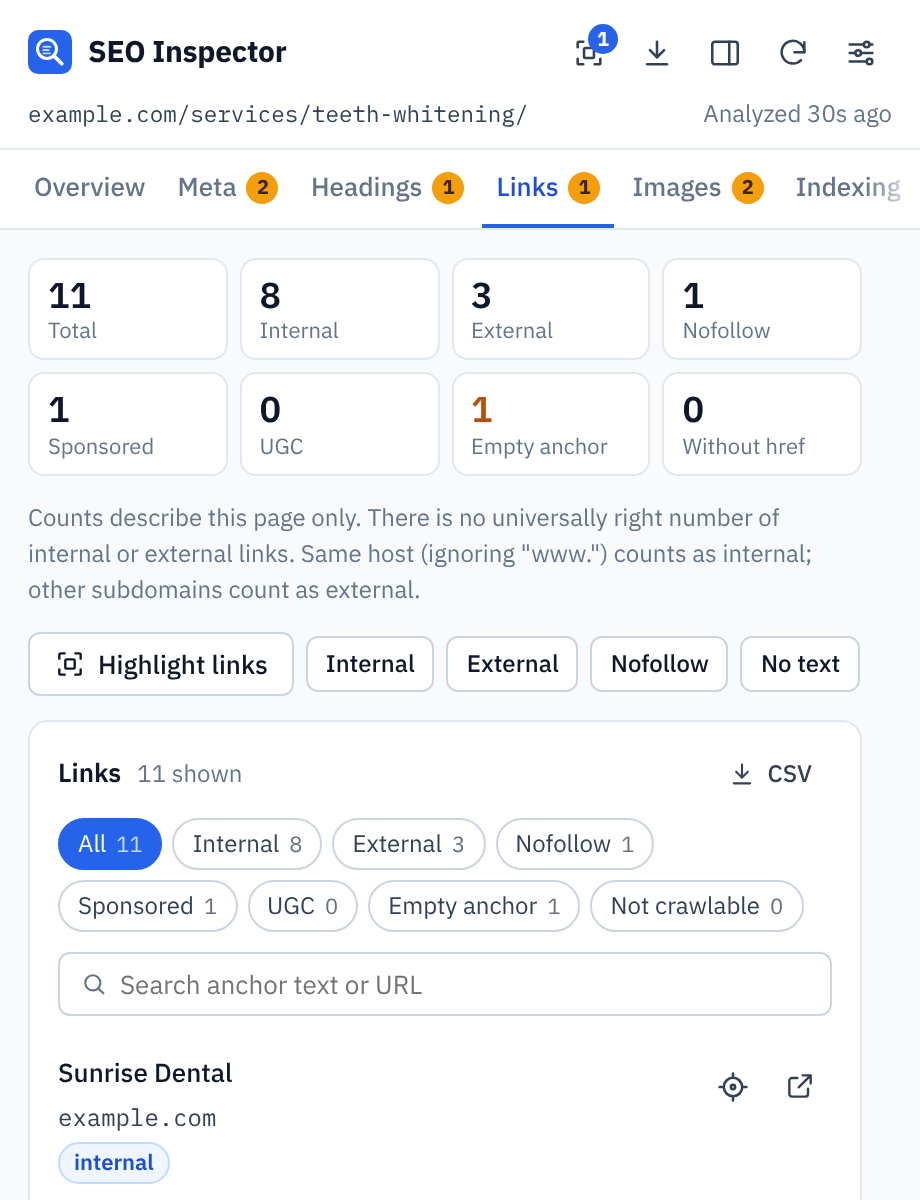
Figure 11: The Links tab with link counts, quick filters and CSV export.
To build stronger internal links, see my internal linking strategy guide.
Images tab
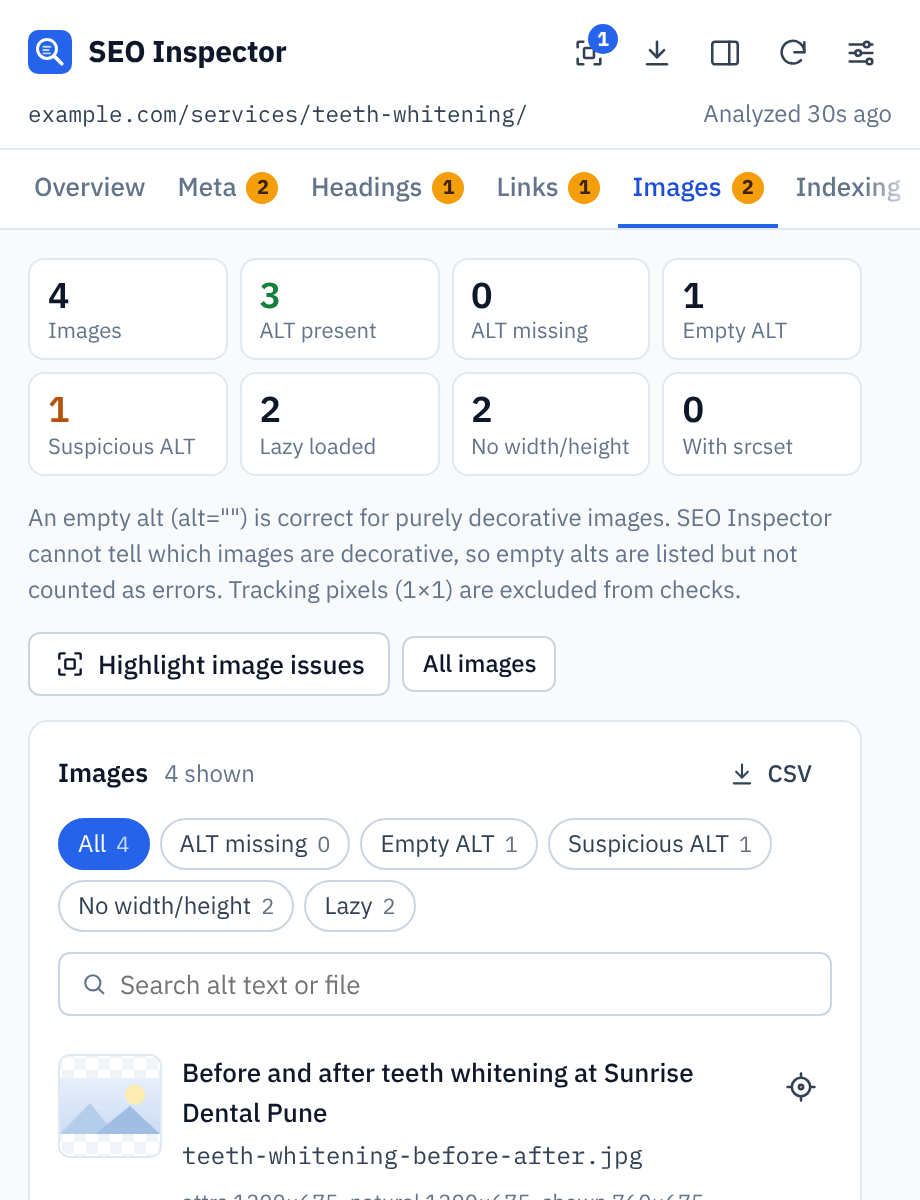
The Images tab checks every image for missing, empty and suspicious alt text, missing width and height, lazy loading and srcset (Figure 12). On our demo page it caught two problems:
- an image with the alt text “IMG_1234”, flagged as Generic alt text because it looks like a camera file name and matches the image’s file name
- two images with no width/height attributes, which can cause layout shifts while the page loads
It also listed one image with an empty alt (alt=””). That is correct for purely decorative images, so SEO Inspector lists it without counting it as an error. You decide whether the image is decorative.
 |
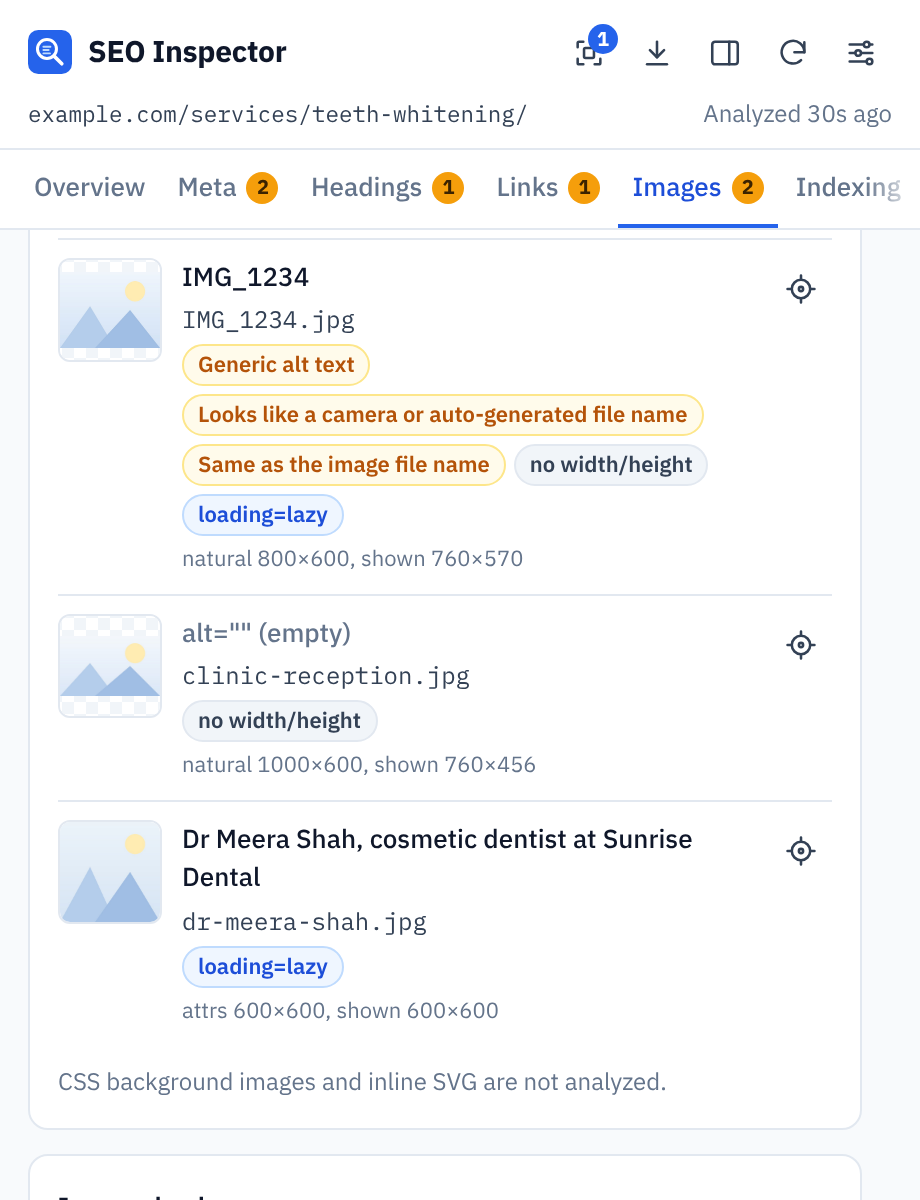 |
Figure 12: The Images tab summary (left) and the image list with each issue labelled (right).
Click Highlight image issues to see the problem images outlined on the page, each with a label that says what is wrong (Figure 13).
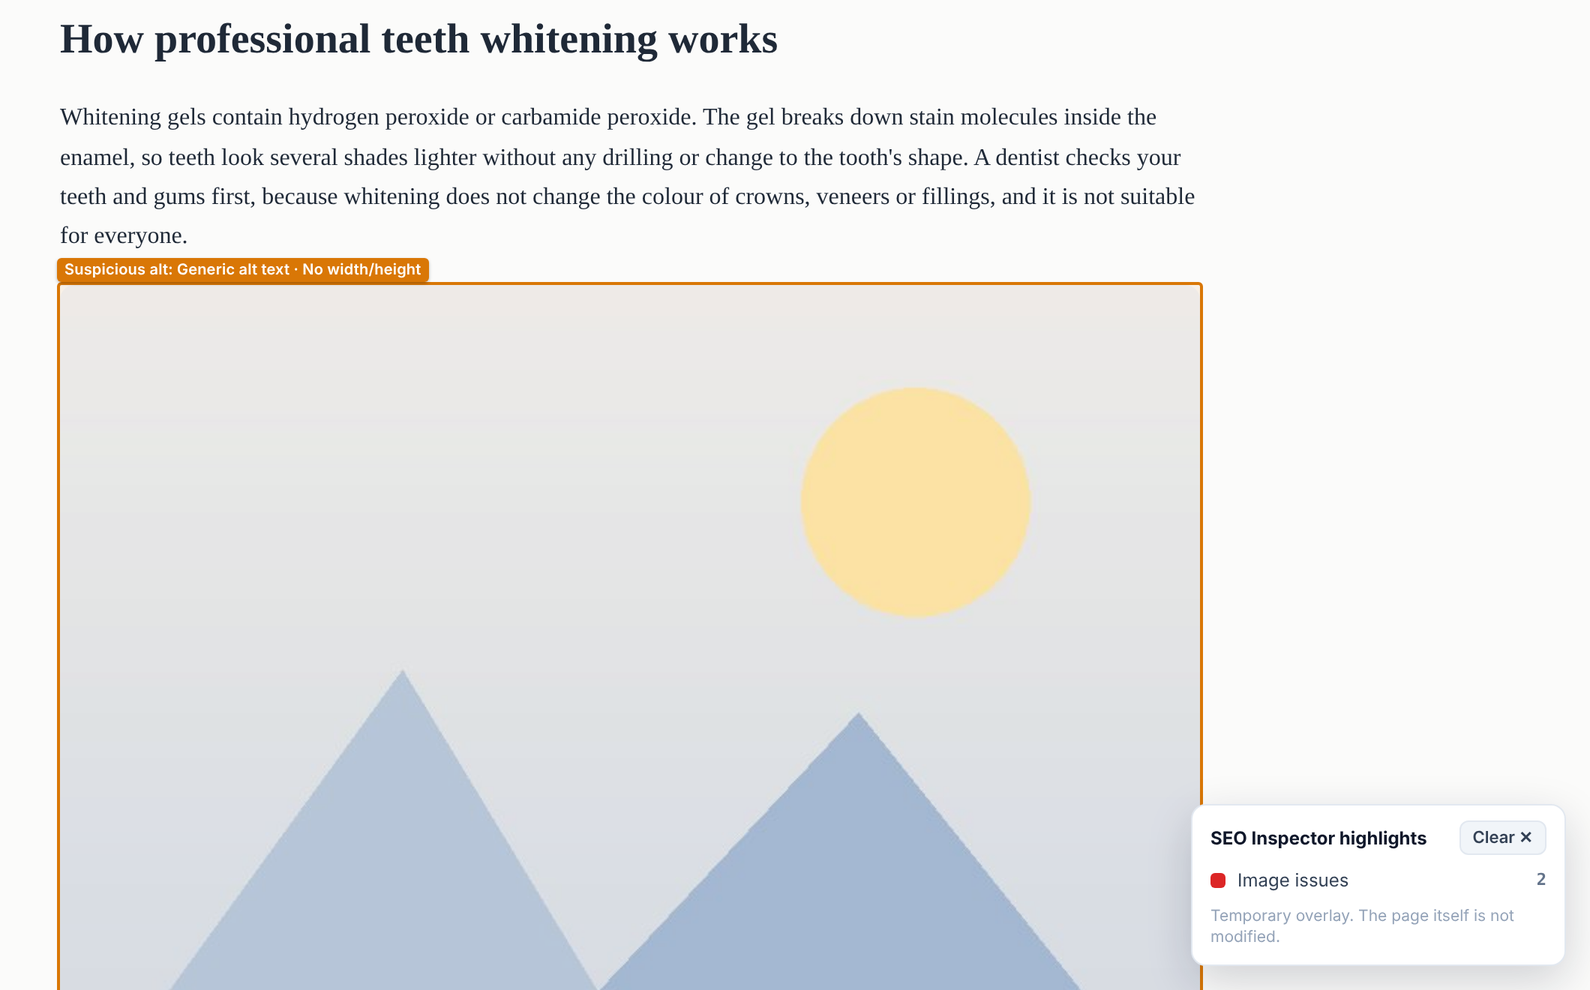
Figure 13: Highlight mode labels the image with generic alt text and no width or height.
For more on alt text, read my guide to image SEO, alt text and file names.
Step 8: Confirm the page can be indexed (Indexing tab)
The Indexing tab answers the most important question first: can this page be indexed? At the top you get a verdict, here Indexable (based on page DOM), followed by the canonical tag, robots directives and page signals such as HTTPS, HTTP status, language, viewport and hreflang (Figure 14).
Behind that verdict it checks for noindex and nofollow in robots meta tags, conflicting robots directives, whether the canonical points to this page, HTTPS and mixed content, the HTTP status, the mobile viewport, the html lang attribute, charset, doctype, meta refresh redirects and hreflang annotations.
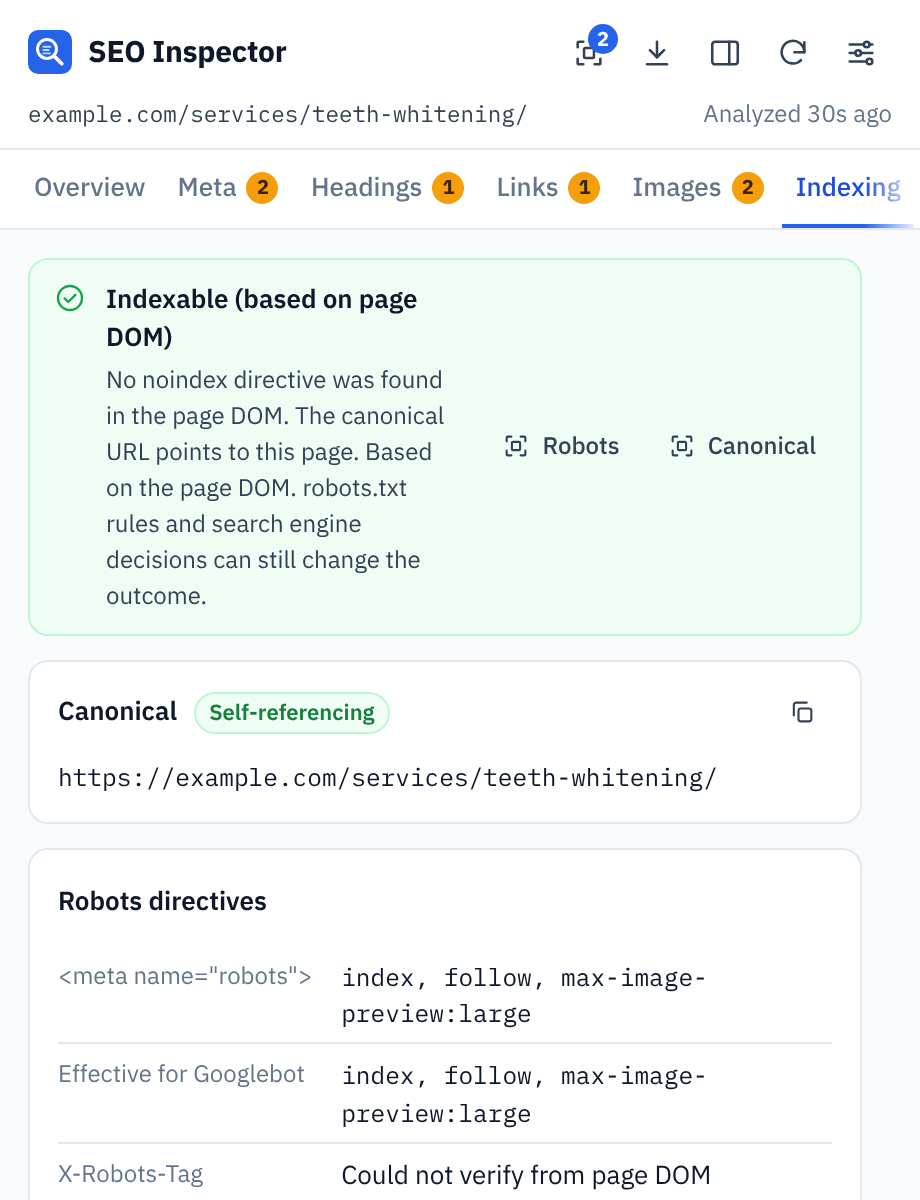
Figure 14: The Indexing tab confirms the page is indexable and the canonical is self-referencing.
| Don’t forget the HTTP headers An X-Robots-Tag: noindex header can block indexing even when the page’s HTML looks fine. Page scripts cannot see HTTP headers, so click Check HTTP headers on this tab (or use the Tools tab in Step 10) to read them. |
To learn more, read canonical tags explained and how to fix indexing issues. To see whether Google has actually indexed a URL, use my free Google indexing checker.
Step 9: Check structured data, social previews and content
Schema tab
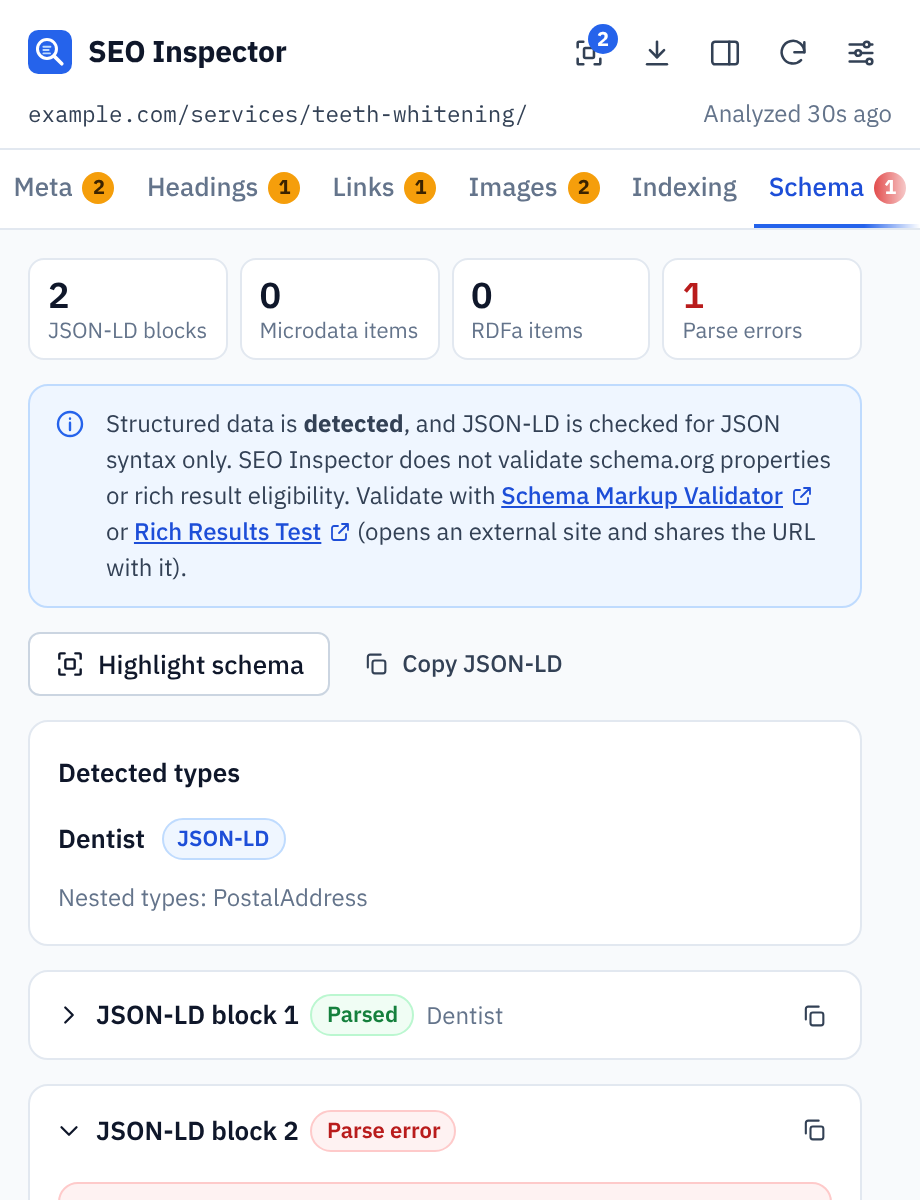
The Schema tab detects JSON-LD, Microdata and RDFa, lists the schema types it found and checks every JSON-LD block for JSON syntax errors (Figure 15).
Our demo page had two JSON-LD blocks. The first (Dentist) parsed fine. The second (BreadcrumbList) showed Parse error, and the message pointed to the exact spot: a trailing comma after the last item in a list. That one comma breaks the whole block, so search engines are likely to ignore it. It was the page’s only critical issue.
 |
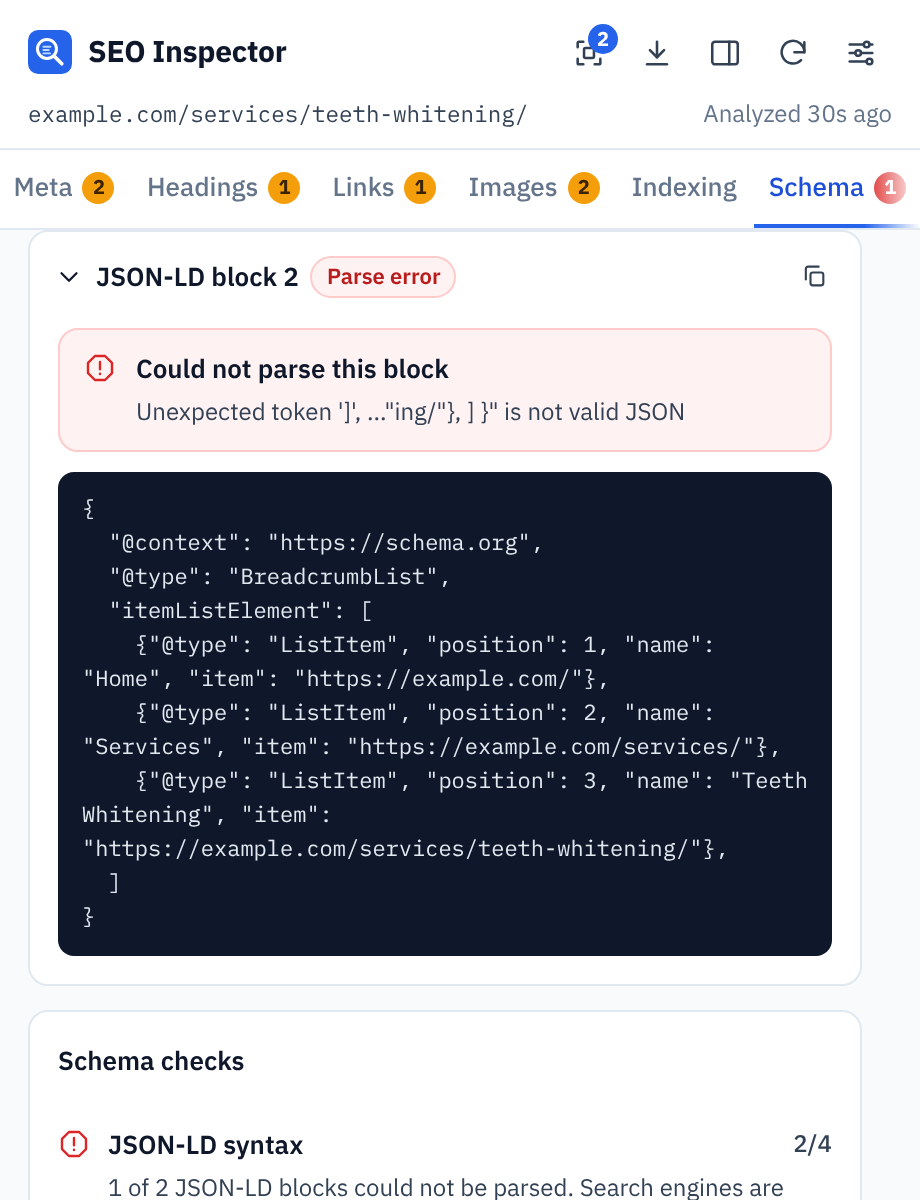 |
Figure 15: The Schema tab summary (left) and the JSON-LD block that failed to parse (right).
Use Copy JSON-LD to grab the code, fix it, then test it with the Schema Markup Validator or Google’s Rich Results Test (both are linked from the tab), or with my free schema markup validator. New to schema? Start with structured data basics.
| Detected, not validated SEO Inspector checks JSON syntax only. It reports structured data as detected, not validated, and it does not confirm whether a page is eligible for rich results. |
Social tab
The Social tab builds an approximate link preview from your Open Graph and Twitter/X tags, so you can see what people get when they share the page (Figure 16). Our demo page showed No image because og:image was missing, and it had no twitter:card tag. The tab lists every Open Graph and Twitter/X tag it found, and every one that is missing.
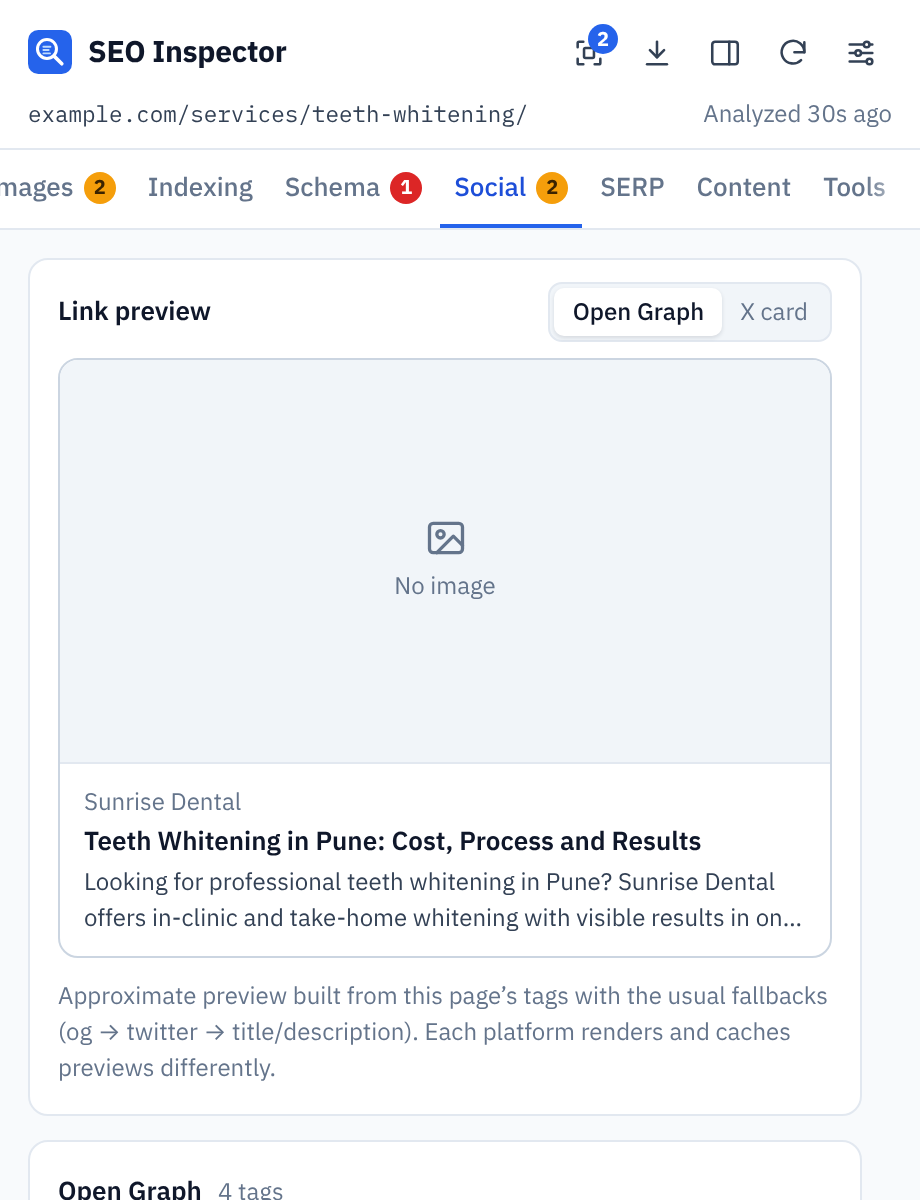
Figure 16: The Social tab’s link preview shows No image because og:image is missing.
Content tab
The Content tab counts visible words, characters, sentences and paragraphs, average sentence and paragraph length, reading time and the words inside <main> (Figure 17). Hidden text is excluded. Frequent terms shows the most used words and two-word phrases on the page.
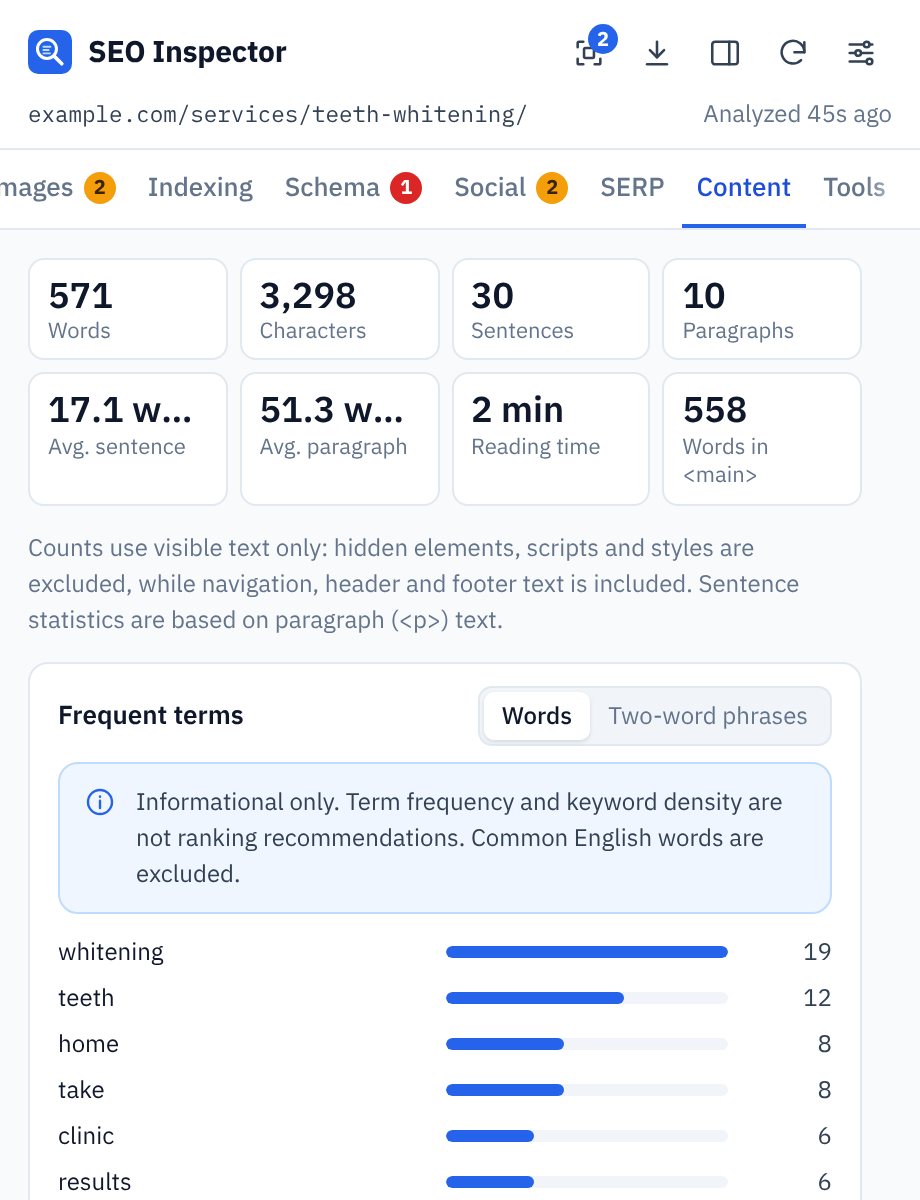
Figure 17: The Content tab with word counts, reading time and frequent terms.
| Informational only Term frequency is not a keyword density target, and word count is not a ranking factor on its own. Use these numbers to spot thin or repetitive pages, not to stuff keywords. |
Step 10: Go deeper with the built-in tools (Tools tab)
The Tools tab is the only place where SEO Inspector makes network requests, and only when you click a button.
robots.txt viewer and path tester
Click Fetch robots.txt to load the site’s robots.txt with a plain-English interpretation (Figure 18). It tells you whether the current page is allowed for Googlebot and for all crawlers, lists each user-agent group with line numbers, and finds any sitemaps declared in the file. Under Test a path, enter any path and pick a crawler (Googlebot, Bingbot, GPTBot, any crawler, or one you type in) to check whether it is allowed.
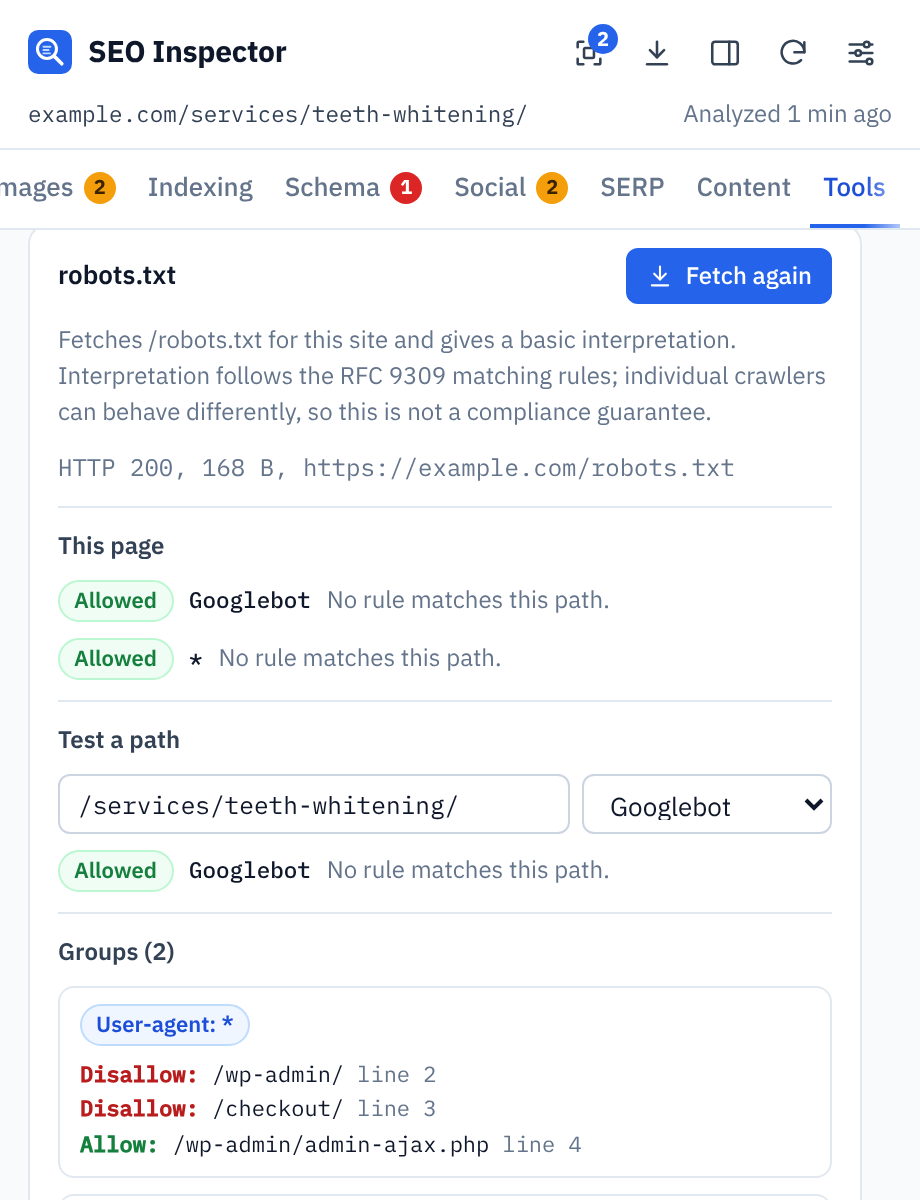
Figure 18: The robots.txt tester confirms that Googlebot is allowed to crawl the demo page.
Thinking about blocking AI crawlers such as GPTBot? Read how to control AI training with robots.txt.
Sitemap inspector
Inspect sitemap reads one sitemap at a time, including sitemap index files and gzipped sitemaps. It shows how many URLs or child sitemaps the file contains with their lastmod dates, and you can click Inspect on a child sitemap to open it (Figure 19). Nothing is crawled. If you need a sitemap first, see XML sitemaps explained or use my free XML sitemap generator.
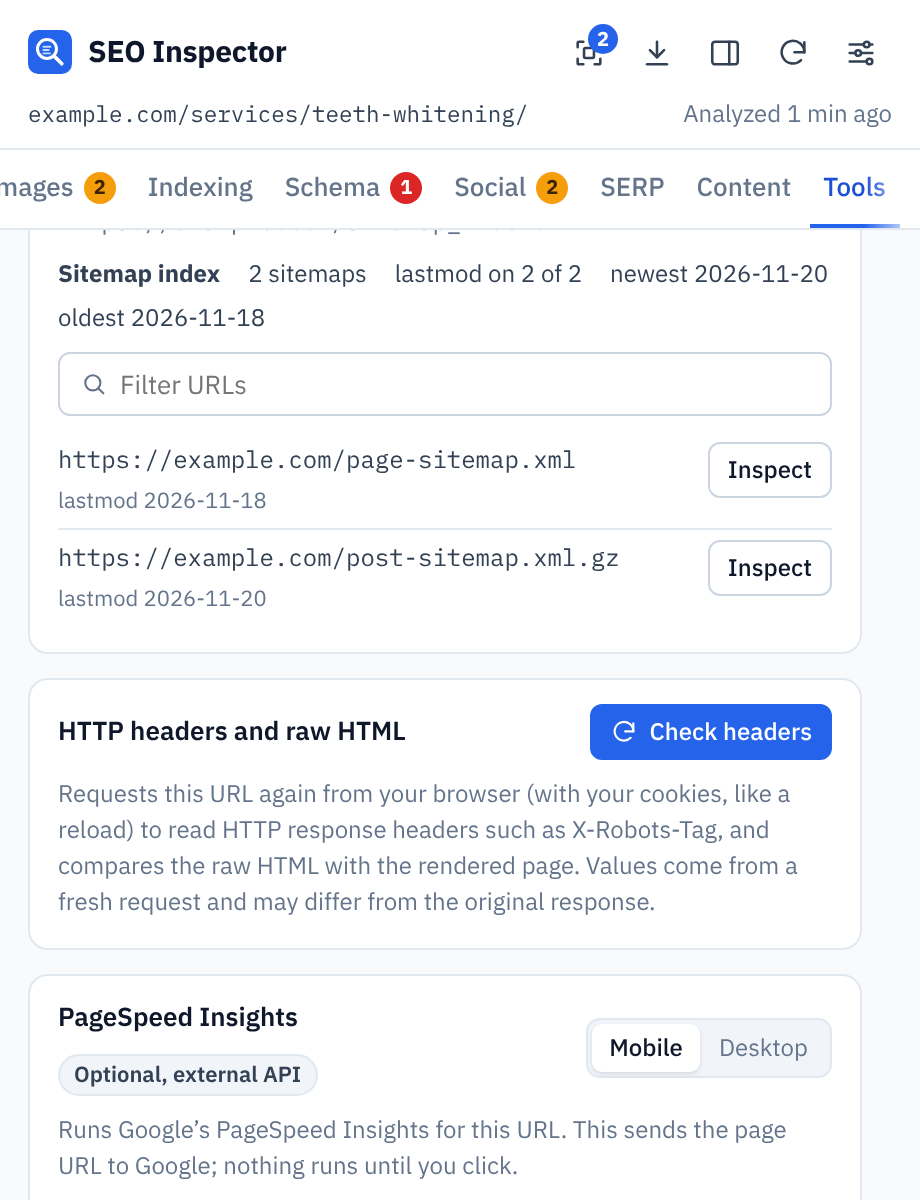
Figure 19: The sitemap inspector reading a sitemap index with two child sitemaps, one of them gzipped.
HTTP headers and raw HTML vs rendered page
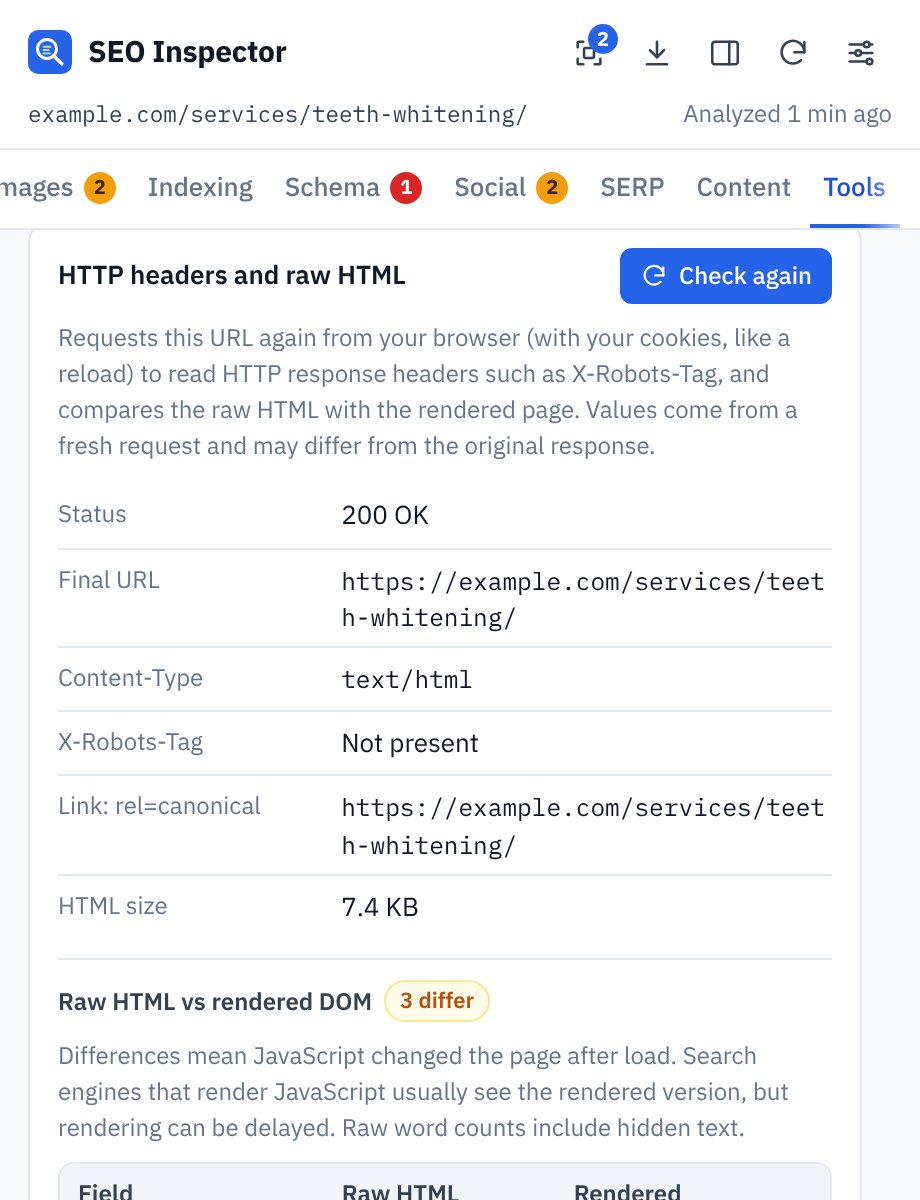
Check headers requests the page again from your browser and shows the status, final URL, content type, X-Robots-Tag and any canonical sent in a Link header. It then compares the raw HTML with the rendered page, field by field (Figure 20). On our demo page three fields differed, because JavaScript added a booking section after the page loaded: one extra heading, one extra link and 13 extra words.
 |
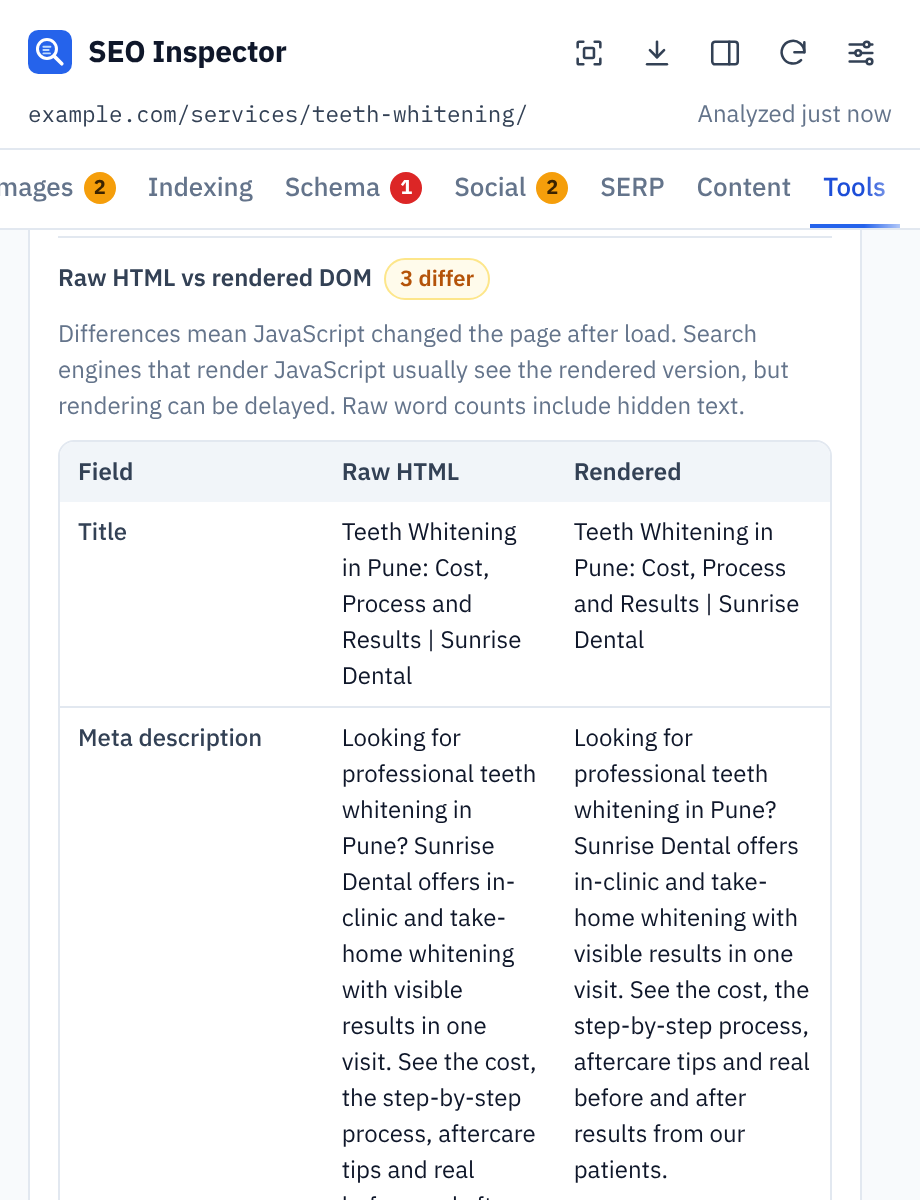 |
Figure 20: HTTP response headers (left) and the raw HTML vs rendered DOM comparison (right).
This matters if your site relies on JavaScript. When important content or links appear only after rendering, search engines can see them later than you expect.
Page timing and PageSpeed Insights
Page timing (measured locally) shows what your browser recorded for this visit: time to first byte (TTFB), First Contentful Paint (FCP), Largest Contentful Paint (LCP) and Cumulative Layout Shift (CLS), plus DOMContentLoaded, the load event, transfer sizes and the number of requests (Figure 21). It is one visit on your device and network, so treat it as a quick sanity check rather than lab data, field data or a score.
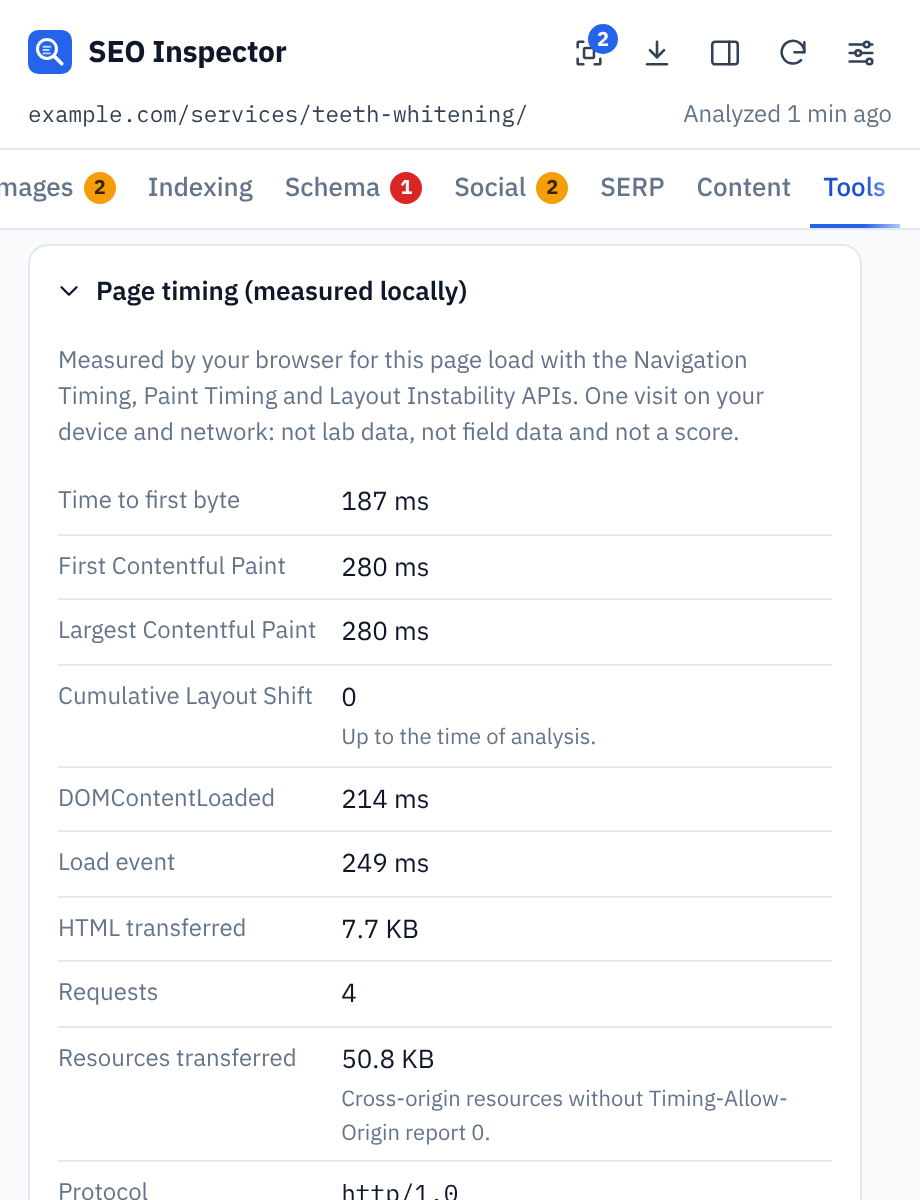
Figure 21: Page timing measured in the browser for one visit to the demo page.
For lab data, run Google PageSpeed Insights from the same tab. Add your own free PageSpeed Insights API key in Settings, or click Try without a key (requests without a key share Google’s public quota and are often rate-limited). Running PageSpeed sends the page URL to Google.
Step 11: Use the side panel and adjust the settings
Keep SEO Inspector open in the side panel
Click Open in side panel (marker 3 in Figure 3) and SEO Inspector docks to the right of the page (Figure 22). It stays open while you scroll and work, and it follows single-page-app navigation. If you want it to re-analyze automatically as you switch tabs, turn on Allow on all sites in Settings. It is optional, and the analysis still happens only in your browser.
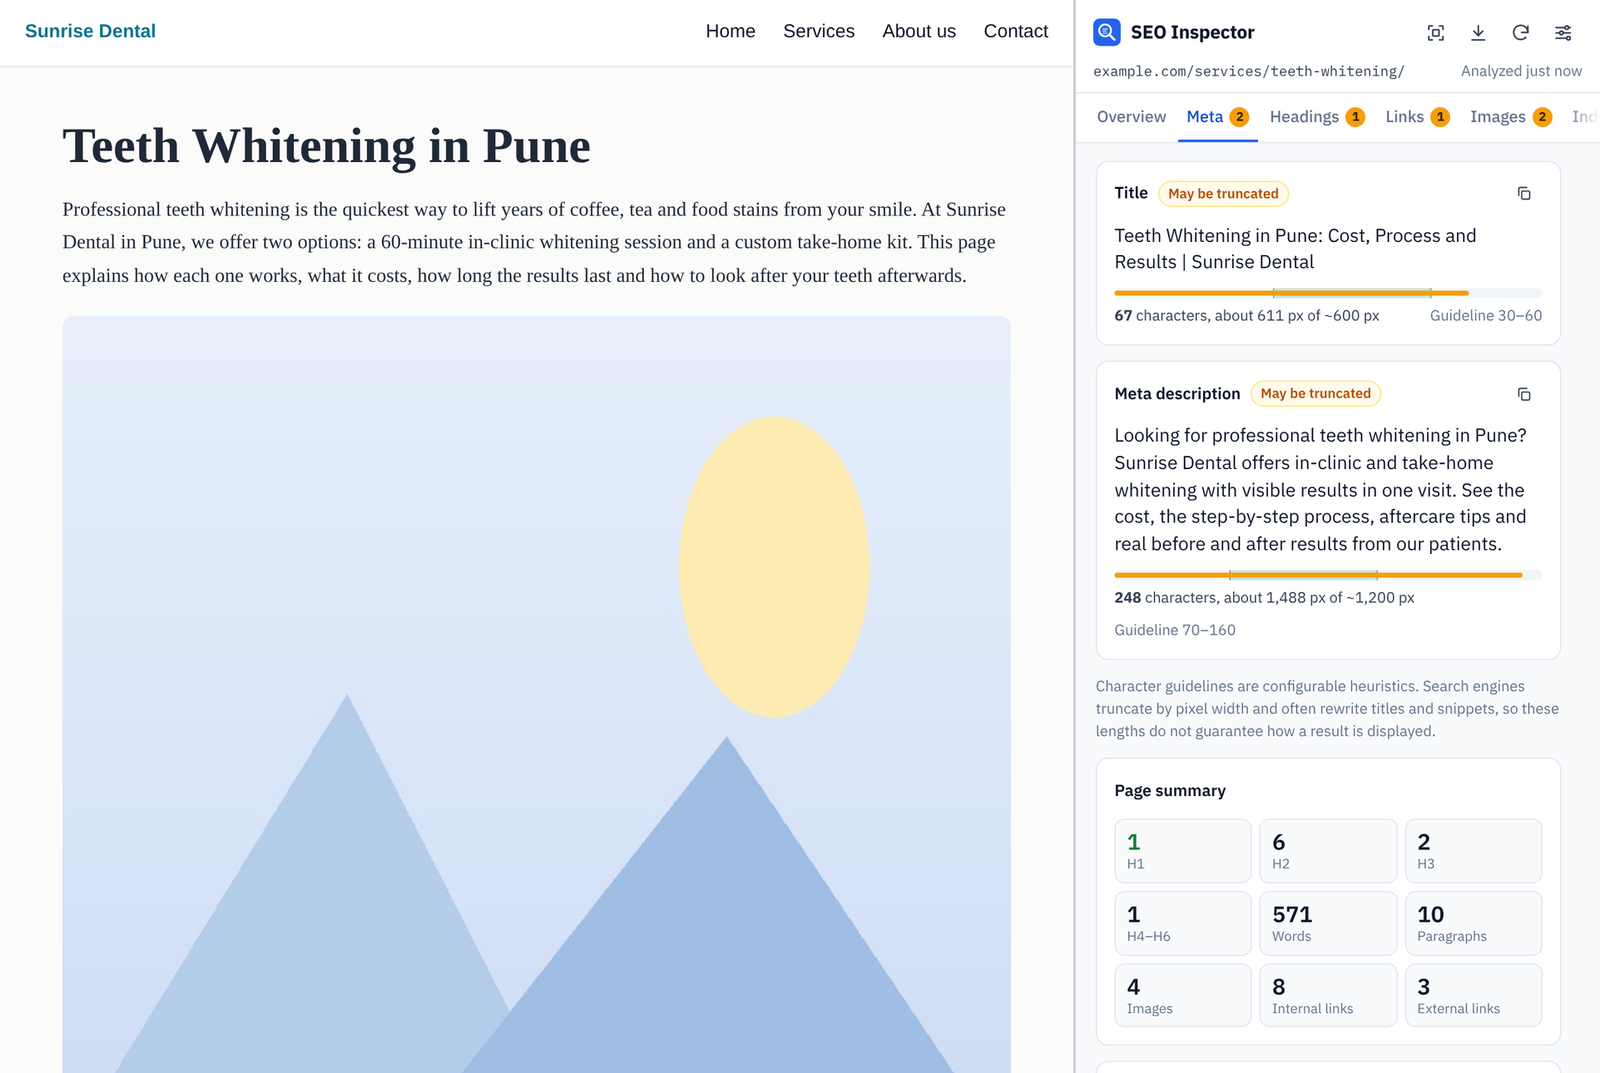
Figure 22: SEO Inspector in Chrome’s side panel, next to the page it is checking.
Settings worth knowing
Click Settings (marker 5) to open the settings page (Figures 23 and 24):
- Toolbar button opens: choose whether the icon opens the popup or the side panel.
- Follow tabs in the side panel: re-analyzes automatically when you switch tabs or the page URL changes.
- Show score on the toolbar icon: shows the score as a badge on the icon: green for 80 and above, amber from 50 to 79 and red below 50.
- Load images in previews: turn it off if you don’t want thumbnails and social previews to load images from their original URLs.
- Allow on all sites: optional site access for the side panel. You can turn it off at any time.
- Scoring weights: drag the sliders to change how much each category counts. Set a category to 0 to ignore it, or click Reset scoring.
- Length and content guidelines: by default, titles 30 to 60 characters, descriptions 70 to 160 characters, a low word count warning below 300 words and an average sentence of up to 25 words. Change them to match your own style guide.
- PageSpeed Insights API key: stored in this browser only. It is never synced or included in exports.
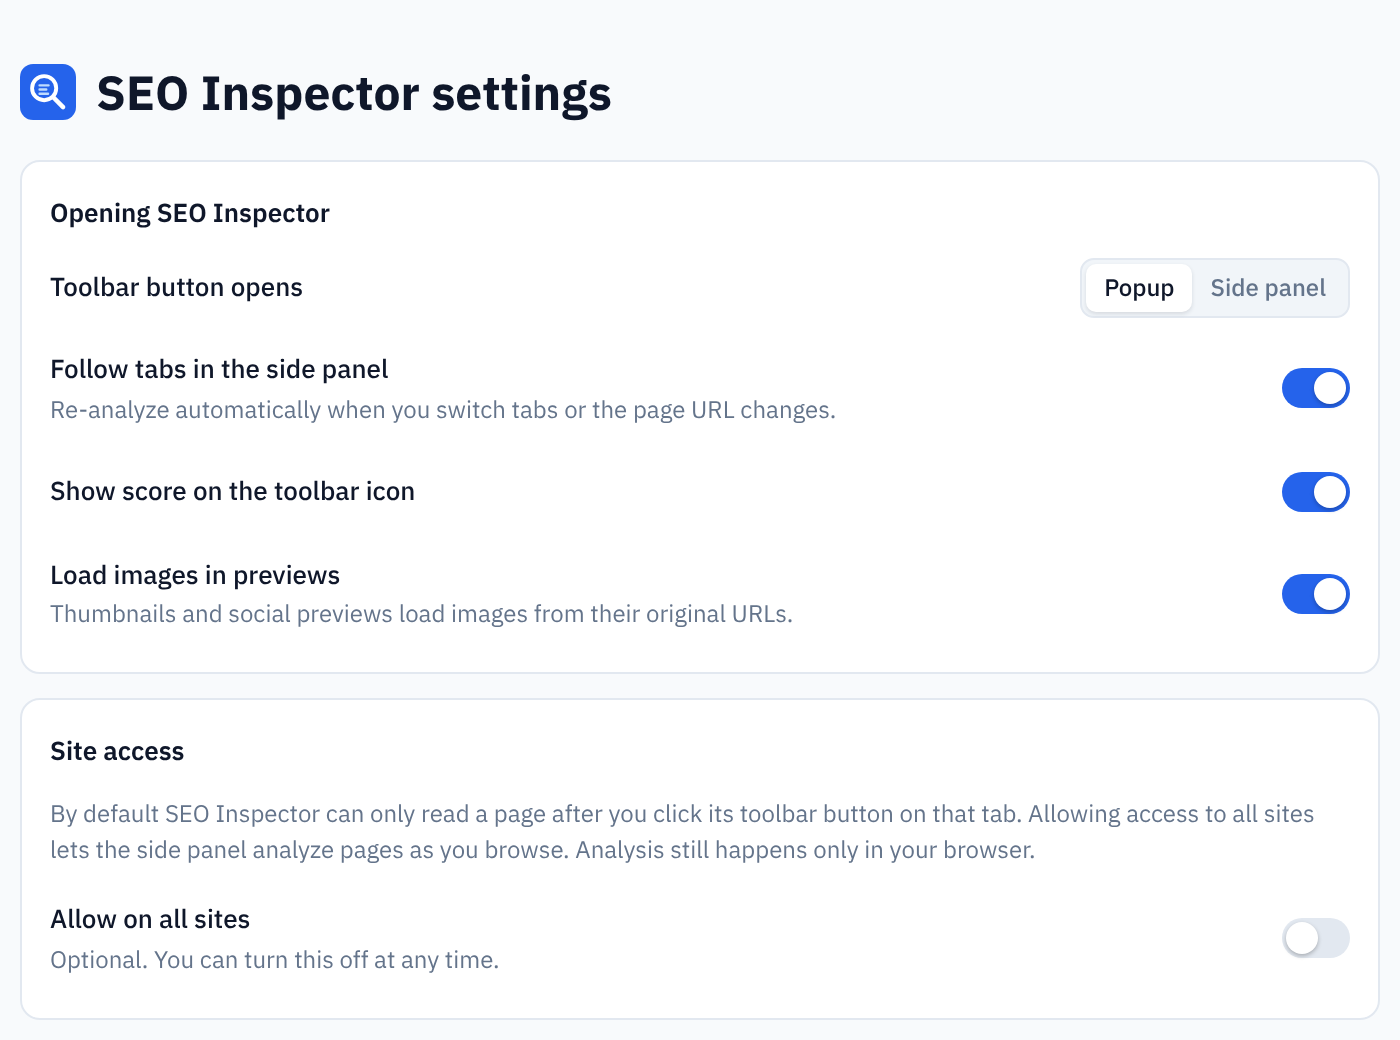
Figure 23: General settings and site access. Allow on all sites is off by default.
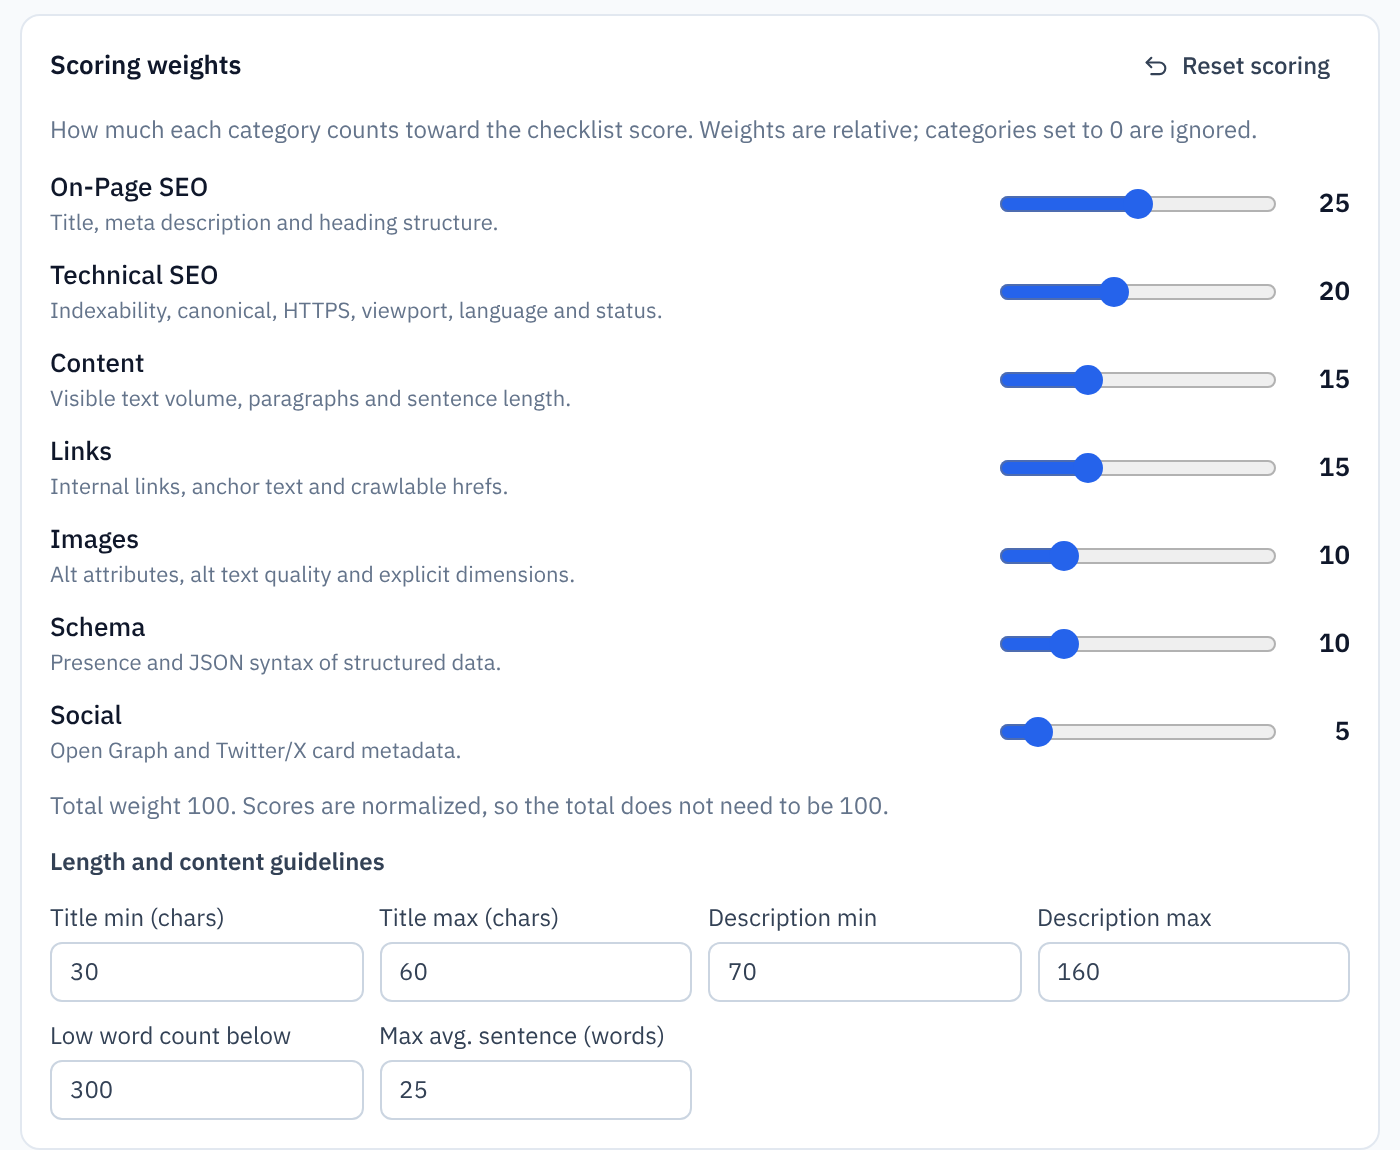
Figure 24: Scoring weights and the default length and content guidelines.
Step 12: Export the audit as an HTML report, CSV or JSON
Click Export report (marker 2), or scroll to the bottom of the Overview tab, and choose HTML report, CSV or JSON (Figure 25). The files are generated locally in your browser.
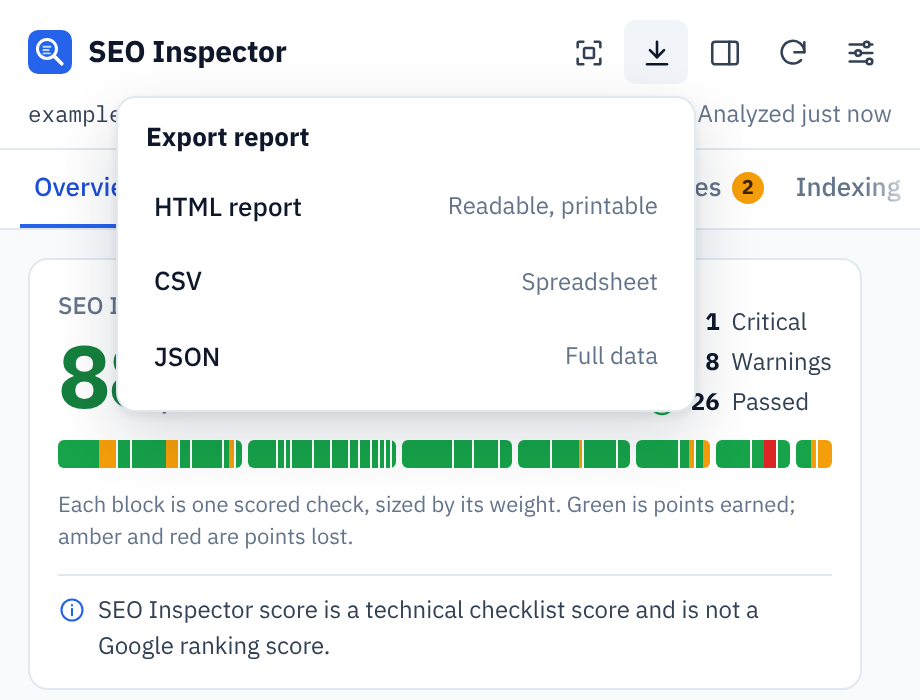
Figure 25: The Export report menu: HTML report, CSV or JSON.
- HTML report: a clean, shareable report with the score, the category breakdown and every issue. Ideal for clients and teammates (Figure 26).
- CSV: open it in Excel or Google Sheets to track fixes.
- JSON: for developers and automated workflows.
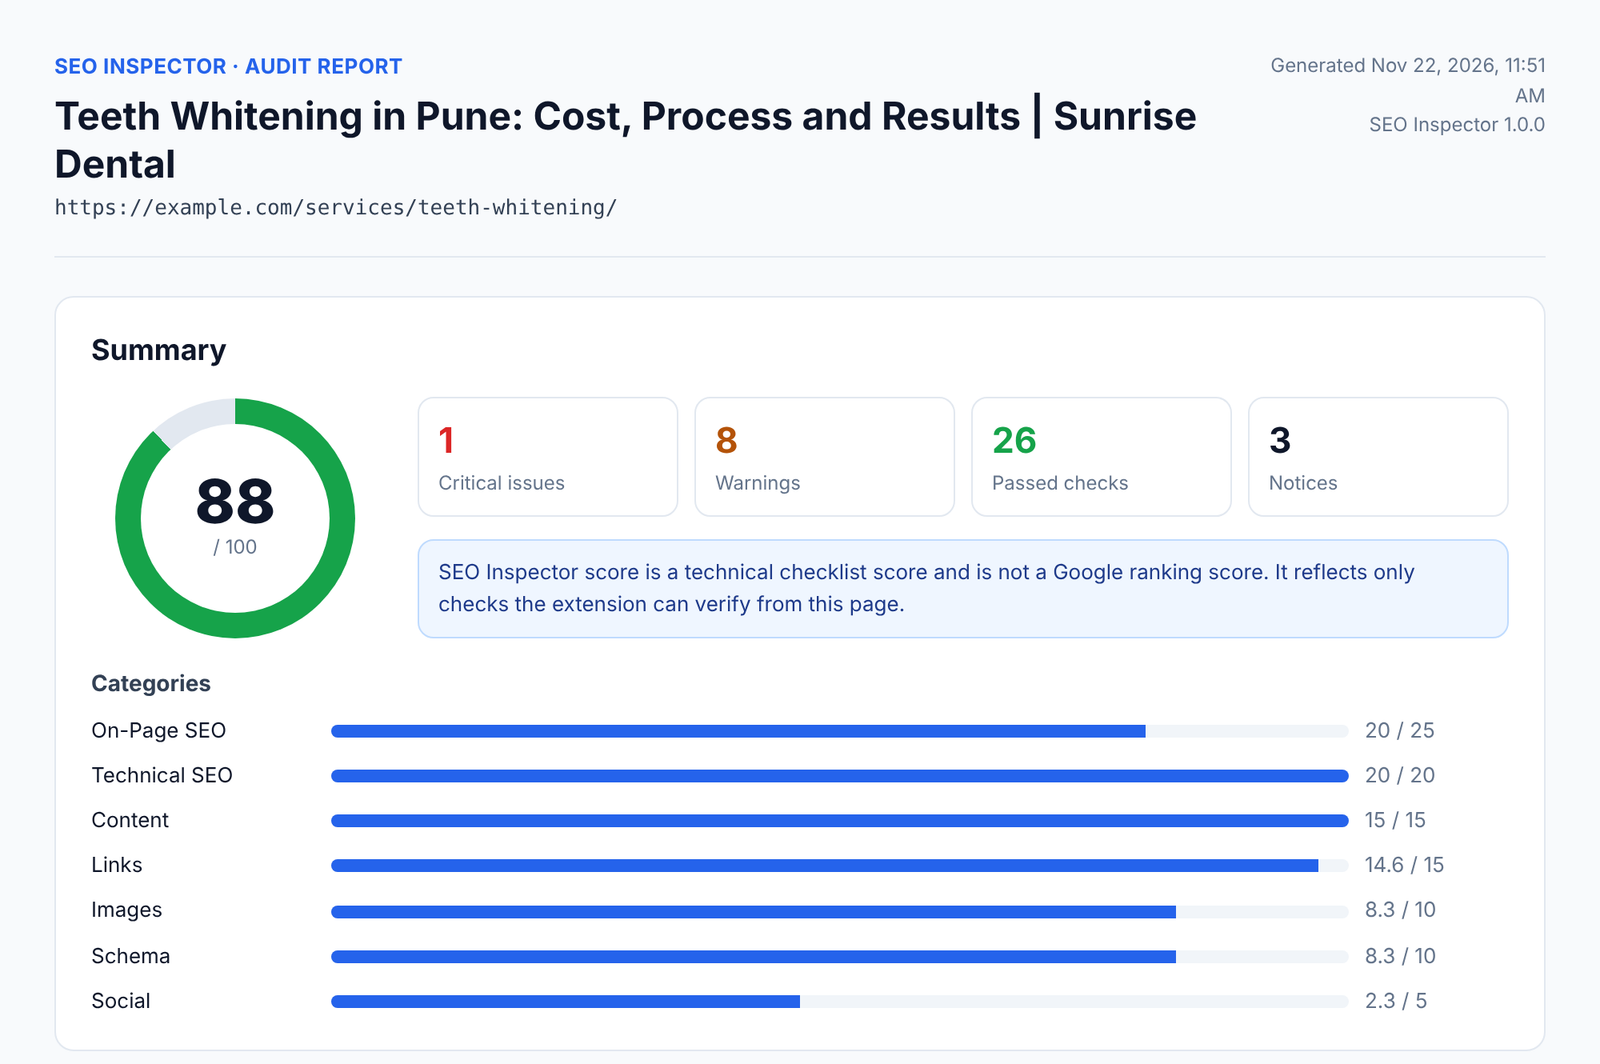
Figure 26: The top of the HTML audit report exported from SEO Inspector.
The result: from 88/100 to 100/100
Here is everything SEO Inspector flagged on the demo page and what we changed to fix it:
| Issue flagged | Tab | What we changed |
|---|---|---|
| JSON-LD syntax (critical) | Schema | Removed the trailing comma in the BreadcrumbList block |
| Title tag too long | Meta, SERP | Shortened it from 67 to 58 characters |
| Meta description too long | Meta, SERP | Rewrote it at 149 characters |
| Heading hierarchy | Headings | Changed the H4 to an H3 |
| Links have anchor text | Links | Added a text label to the Instagram icon link |
| Alt text quality | Images | Replaced “IMG_1234” with a descriptive alt text |
| Explicit dimensions | Images | Added width and height to the two images |
| Open Graph tags | Social | Added og:image (and og:description) |
| Twitter/X card | Social | Added a twitter:card tag |
We also gave the clinic reception photo a descriptive alt text, because it was not a decorative image. After clicking Re-analyze page, the score went to 100/100, with 0 critical issues, 0 warnings and 36 passed checks (Figure 27).
 |
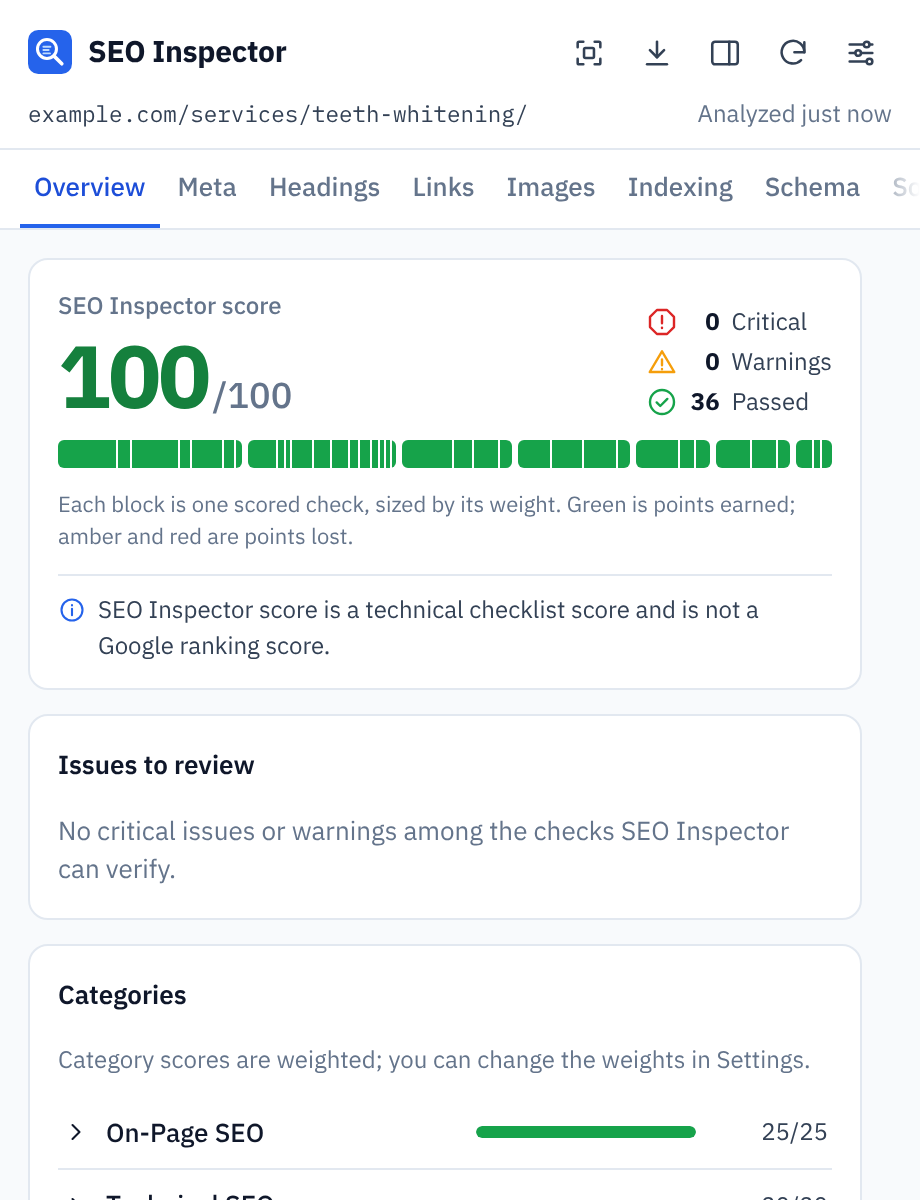 |
Figure 27: The demo page before (88/100, left) and after fixing every flagged issue (100/100, right).
| A perfect score is a starting point 100/100 means the technical basics on this page are in place. It does not guarantee rankings. Content quality, search intent, links and competition still decide where a page ranks. |
For a deeper explanation of crawler access rules, see the complete robots.txt SEO guide. For a broader technical review, use the technical SEO checklist.
Who should use SEO Inspector?
- Small business owners: check your own pages before and after you publish, without learning a paid tool.
- SEO specialists and consultants: run quick spot checks on client and competitor pages, and share an HTML report.
- Content writers and editors: check titles, descriptions, headings and alt text before you hit Publish.
- Developers: verify canonical, robots and hreflang tags, catch JSON-LD syntax errors and compare raw and rendered HTML.
Privacy and permissions
SEO Inspector is private by design:
- No account, no subscription, no ads and no tracking.
- The analysis runs locally in your browser. Page content is never sent to any server.
- It reads a page only when you open it on that page.
- Features that make a network request (robots.txt, sitemaps, the header check and PageSpeed Insights) run only when you click them.
- It uses four permissions: activeTab, scripting, storage and sidePanel. Access to all sites is optional.
You can read the full details in the SEO Inspector privacy policy.
7 tips to get more out of SEO Inspector
- Pin the icon and learn Alt+Shift+S. Checking a page becomes a two-second habit.
- Check drafts and staging pages before you publish. SEO Inspector reads the page in your browser, so it also works on pages behind a login.
- Re-analyze after every change to confirm the fix worked.
- Use Highlight mode when you explain issues to a client or a writer. Pointing at the page beats describing it.
- Compare raw and rendered HTML on JavaScript-heavy pages.
- Adjust the weights to the page type. For example, set Social to 0 for pages nobody shares.
- Export the HTML report before and after a round of fixes to show progress.
Frequently asked questions
Is SEO Inspector free?
Yes. SEO Inspector is free, with no account, subscription or ads. The optional PageSpeed Insights feature works best with your own free Google API key.
Does the SEO Inspector score affect my Google rankings?
No. It is a technical checklist score, not a Google ranking score. It shows how many on-page basics are in place, and it does not predict rankings or traffic.
Does SEO Inspector send my page data anywhere?
No. The analysis runs locally in your browser. The only requests happen when you click a tool: robots.txt and header checks go to the site you are viewing, a sitemap check goes to the sitemap’s host (Chrome asks you first if it is another domain), and PageSpeed Insights sends the page URL to Google.
Can I check a competitor’s page?
Yes. You can run SEO Inspector on any web page you can open in Chrome.
Why doesn’t SEO Inspector work on some pages?
Chrome doesn’t let extensions run on its own pages, such as chrome:// pages, the Chrome Web Store and browser error pages. Open a normal web page and try again.
Does SEO Inspector validate schema markup?
It detects JSON-LD, Microdata and RDFa and checks JSON-LD for syntax errors. It does not validate schema.org properties or rich result eligibility, so use the Schema Markup Validator or Google’s Rich Results Test for that.
Does it work with single-page apps?
Yes. In the side panel it follows single-page-app navigation, and the raw vs rendered comparison in the Tools tab shows what JavaScript changed on the page.
Can I change the keyboard shortcut?
Yes. Go to chrome://extensions/shortcuts and set a new shortcut for SEO Inspector.
Your SEO Inspector checklist
☐ Install and pin SEO Inspector
☐ Open it on your most important page (Alt+Shift+S)
☐ Fix critical issues first, then warnings
☐ Title and meta description fit the pixel bars, and the SERP preview reads well
☐ One H1 and no skipped heading levels
☐ Descriptive alt text, plus width and height, on every image
☐ No links with empty anchor text
☐ Page is indexable, with a self-referencing canonical and no X-Robots-Tag noindex
☐ Every JSON-LD block parses without errors
☐ og:image and twitter:card are set
☐ Re-analyze, then export the HTML report
| Add SEO Inspector to Chrome. It’s free. Install SEO Inspector from the Chrome Web Store and run it on your most important page today. Want someone to check your whole site? SEO Inspector checks one page at a time. If you would like me to look at your site and tell you what to fix first, request a free SEO audit. You get a plain-English list of fixes, by email. |
| Written by Anand Bajrangi Anand Bajrangi is an SEO consultant and author from India. He taught himself SEO starting in 2020, co-founded EvolvCode Solutions in 2023 and has worked with more than 100 businesses. He is the author of The Truth About SEO and SEO Words Made Simple, and he builds free SEO tools, including SEO Inspector and the Anand Bajrangi SEO plugin for WordPress. More about Anand. |